| Param | Original file | Final file |
|---|---|---|
| Filename | modeM0/AS1T01_072T05_9000000344cztM0_level2.evt | modeM0/AS1T01_072T05_9000000344cztM0_level2_quad_clean.evt |
| Size (bytes) | 7,525,704,960 | 1,445,731,200 |
| Size | 7.0 GB | 1.3 GB |
| Events in quadrant A | 53,977,013 | 8,798,807 |
| Events in quadrant B | 56,393,628 | 9,037,828 |
| Events in quadrant C | 54,792,211 | 8,940,550 |
| Events in quadrant D | 54,556,606 | 8,698,353 |
| Mode SS | |||
|---|---|---|---|
| Quadrant | BADHDUFLAG | Total packets | Discarded packets |
| A | 0 | 2432 | 0 |
| B | 0 | 2434 | 0 |
| C | 0 | 2432 | 0 |
| D | 0 | 2434 | 0 |
| Mode M0 | |||
|---|---|---|---|
| Quadrant | BADHDUFLAG | Total packets | Discarded packets |
| A | 0 | 249039 | 0 |
| B | 0 | 252417 | 0 |
| C | 0 | 249759 | 0 |
| D | 0 | 254779 | 0 |
| Mode M9 | |||
|---|---|---|---|
| Quadrant | BADHDUFLAG | Total packets | Discarded packets |
| A | 0 | 15 | 0 |
| B | 1 | 15 | 0 |
| C | 1 | 15 | 0 |
| D | 1 | 1 | 0 |
| Quadrant | Total seconds | Saturated seconds | Saturation percentage |
|---|---|---|---|
| A | 121298 | 1213 | 1.000016% |
| B | 121353 | 1477 | 1.217110% |
| C | 121340 | 956 | 0.787869% |
| D | 121340 | 1117 | 0.920554% |
Noise dominated data is calculated using 1-second bins in cleaned event files. If a bin has >2000 counts, and if more than 50% of those come from <1% of pixels, then it is considered to be noise-dominated and hence unusable.
| Quadrant | # 1 sec bins | Bins with >0 counts | Bins with >2000 counts | High rate bins dominated by noise | Noise dominated (total time) | Noise dominated (detector-on time) | Marked lightcurve |
|---|---|---|---|---|---|---|---|
| A | 157728 | 121373 | 3 | 3 | 0.00% | 0.00% | 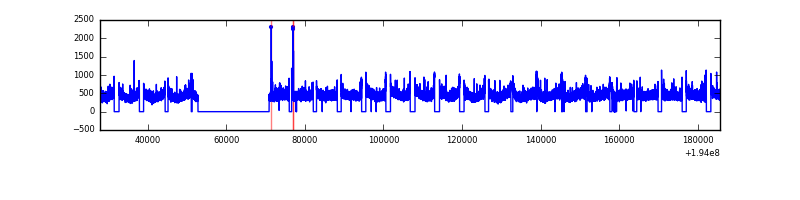 |
| B | 157728 | 121433 | 31 | 31 | 0.02% | 0.03% |  |
| C | 157728 | 121414 | 22 | 22 | 0.01% | 0.02% |  |
| D | 157728 | 121427 | 216 | 216 | 0.14% | 0.18% |  |
Top three noisy pixels from each quadrant. If the there are fewer than three noisy pixels in the level2.evt file, extra rows are filled as -1
| Pixel properties | Quadrant properties | ||||||
|---|---|---|---|---|---|---|---|
| Quadrant | DetID | PixID | Counts | Sigma | Mean | Median | Sigma |
| A | 12 | 194 | 160041 | 51.34 | 13970 | 13677 | 2851.1 |
| A | 0 | 226 | 151051 | 48.18 | 13970 | 13677 | 2851.1 |
| A | 15 | 47 | 94743 | 28.43 | 13970 | 13677 | 2851.1 |
| B | 4 | 48 | 524036 | 186.55 | 14335 | 13972 | 2734.2 |
| B | 15 | 85 | 234569 | 80.68 | 14335 | 13972 | 2734.2 |
| B | 12 | 111 | 200562 | 68.24 | 14335 | 13972 | 2734.2 |
| C | 5 | 234 | 240748 | 70.78 | 13766 | 13780 | 3206.8 |
| C | 1 | 192 | 167532 | 47.94 | 13766 | 13780 | 3206.8 |
| C | 8 | 112 | 160575 | 45.78 | 13766 | 13780 | 3206.8 |
| D | 10 | 172 | 1297082 | 394.77 | 13632 | 13277 | 3252.1 |
| D | 6 | 112 | 274374 | 80.29 | 13632 | 13277 | 3252.1 |
| D | 12 | 79 | 261657 | 76.38 | 13632 | 13277 | 3252.1 |
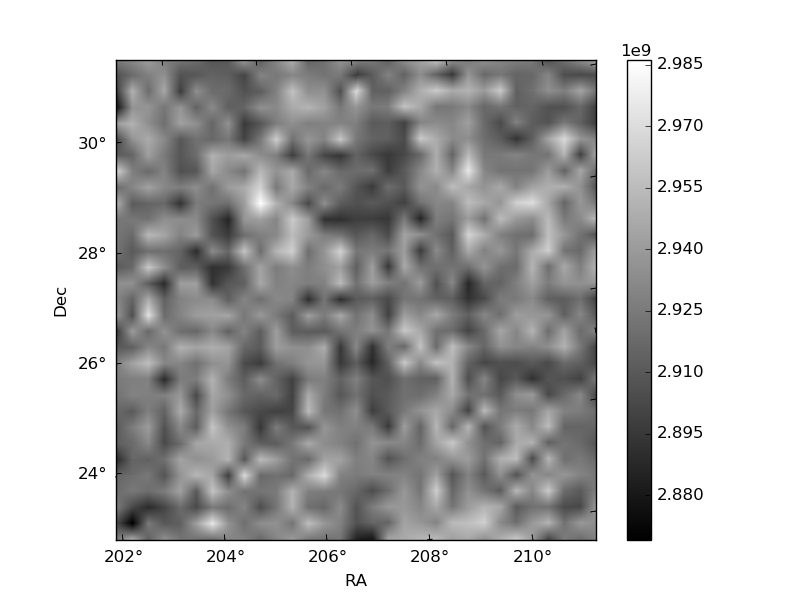
Histogram calculated using DETX and DETY for each event in the final _common_clean file
| Quadrant A | 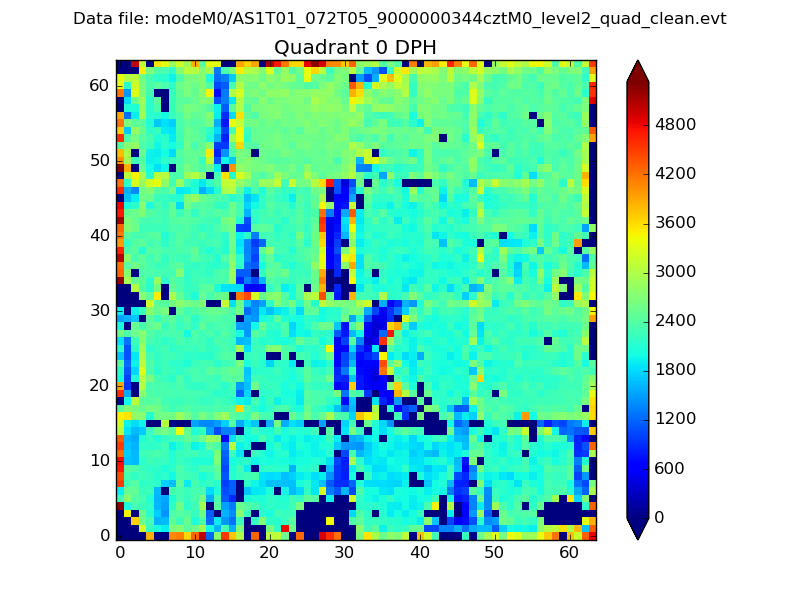 |
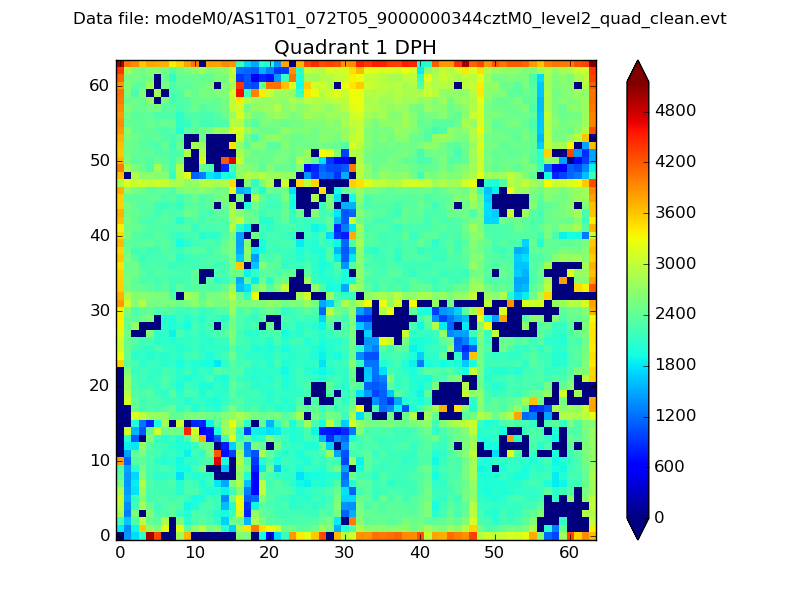 |
Quadrant B |
|---|---|---|---|
| Quadrant D |  |
 |
Quadrant C |
| Plot type | Count rate plots | Images |
|---|---|---|
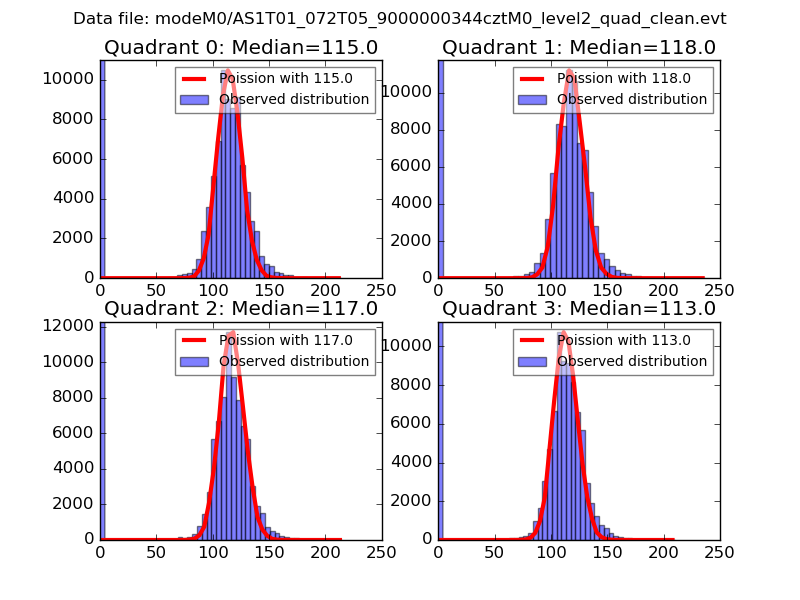
| Comparison with Poisson distribution Blue bars denote a histogram of data divided into 1 sec bins. Red curve is a Poisson curve with rate = median count rate of data. |
 |
 |
| Quadrant-wise count rates Data is divided into 100 sec bins |
 |
|
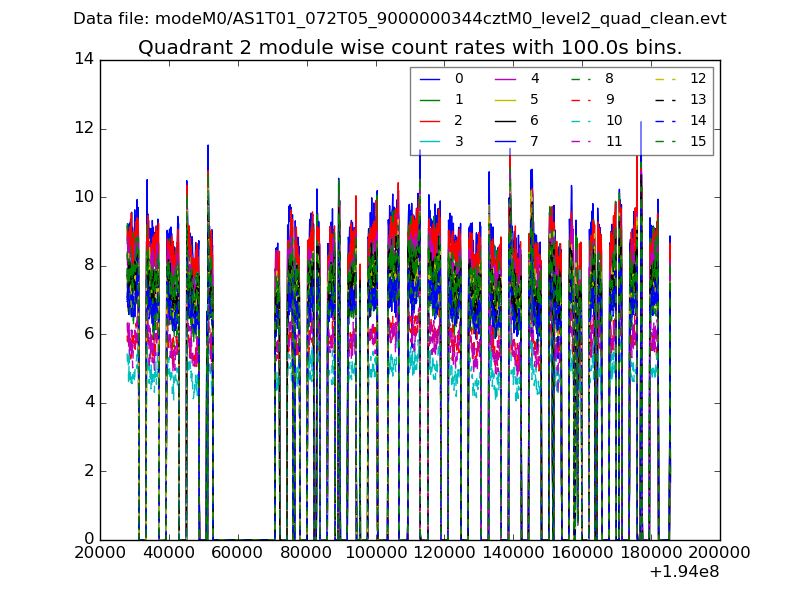
| Module-wise count rates for Quadrant A Data is divided into 100 sec bins |
 |
 |
| Module-wise count rates for Quadrant B Data is divided into 100 sec bins |
 |
 |
| Module-wise count rates for Quadrant C Data is divided into 100 sec bins |
 |
 |
| Module-wise count rates for Quadrant D Data is divided into 100 sec bins |
 |
 |
| Parameter | Plot |
|---|---|
| CZT HV Monitor |  |
| D_VDD | 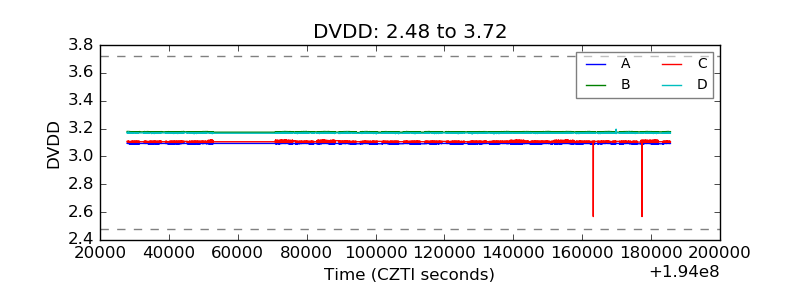 |
| Temperature 1 | 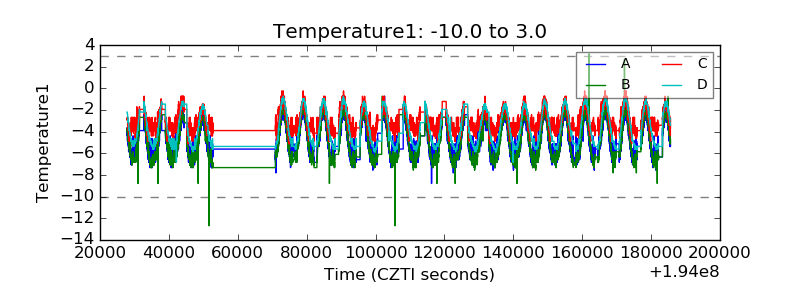 |
| Veto HV Monitor |  |
| Veto LLD |  |
| Alpha Counter |  |
| _CPM_Rate |  |
| CZT Counter |  |
| +2.5 Volts monitor |  |
| +5 Volts monitor |  |
| _ROLL_ROT |  |
| _Roll_DEC |  |
| _Roll_RA |  |
| Veto Counter |  |