| Param | Original file | Final file |
|---|---|---|
| Filename | modeM0/AS1T01_072T04_9000000342cztM0_level2.evt | modeM0/AS1T01_072T04_9000000342cztM0_level2_quad_clean.evt |
| Size (bytes) | 11,579,261,760 | 736,346,880 |
| Size | 10.8 GB | 702.2 MB |
| Events in quadrant A | 59,751,967 | 5,180,888 |
| Events in quadrant B | 55,306,210 | 5,280,943 |
| Events in quadrant C | 159,568,815 | 2,111,569 |
| Events in quadrant D | 70,811,932 | 4,339,052 |
| Mode SS | |||
|---|---|---|---|
| Quadrant | BADHDUFLAG | Total packets | Discarded packets |
| A | 0 | 1578 | 0 |
| B | 0 | 1578 | 0 |
| C | 0 | 1578 | 0 |
| D | 0 | 1578 | 0 |
| Mode M0 | |||
|---|---|---|---|
| Quadrant | BADHDUFLAG | Total packets | Discarded packets |
| A | 0 | 232989 | 0 |
| B | 0 | 219295 | 0 |
| C | 0 | 530577 | 0 |
| D | 0 | 270327 | 0 |
| Mode M9 | |||
|---|---|---|---|
| Quadrant | BADHDUFLAG | Total packets | Discarded packets |
| A | 0 | 27 | 0 |
| B | 0 | 15 | 0 |
| C | 0 | 15 | 0 |
| D | 0 | 28 | 0 |
| Quadrant | Total seconds | Saturated seconds | Saturation percentage |
|---|---|---|---|
| A | 78094 | 12535 | 16.051169% |
| B | 78042 | 10136 | 12.987878% |
| C | 78255 | 61072 | 78.042298% |
| D | 78132 | 16465 | 21.073312% |
Noise dominated data is calculated using 1-second bins in cleaned event files. If a bin has >2000 counts, and if more than 50% of those come from <1% of pixels, then it is considered to be noise-dominated and hence unusable.
| Quadrant | # 1 sec bins | Bins with >0 counts | Bins with >2000 counts | High rate bins dominated by noise | Noise dominated (total time) | Noise dominated (detector-on time) | Marked lightcurve |
|---|---|---|---|---|---|---|---|
| A | 91326 | 78110 | 10685 | 10685 | 11.70% | 13.68% |  |
| B | 91326 | 78056 | 9176 | 9176 | 10.05% | 11.76% |  |
| C | 91326 | 78280 | 52946 | 52946 | 57.97% | 67.64% |  |
| D | 91326 | 78148 | 15732 | 15732 | 17.23% | 20.13% |  |
Top three noisy pixels from each quadrant. If the there are fewer than three noisy pixels in the level2.evt file, extra rows are filled as -1
| Pixel properties | Quadrant properties | ||||||
|---|---|---|---|---|---|---|---|
| Quadrant | DetID | PixID | Counts | Sigma | Mean | Median | Sigma |
| A | 15 | 171 | 6721244 | 3660.74 | 8283 | 8036 | 1833.8 |
| A | 3 | 159 | 5722663 | 3116.21 | 8283 | 8036 | 1833.8 |
| A | 3 | 254 | 3650786 | 1986.41 | 8283 | 8036 | 1833.8 |
| B | 3 | 191 | 17981064 | 10113.69 | 8370 | 8083 | 1777.1 |
| B | 14 | 181 | 627788 | 348.72 | 8370 | 8083 | 1777.1 |
| B | 15 | 26 | 427829 | 236.2 | 8370 | 8083 | 1777.1 |
| C | 0 | 187 | 42529926 | 27711.31 | 3953 | 3805 | 1534.6 |
| C | 7 | 111 | 33584490 | 21882.2 | 3953 | 3805 | 1534.6 |
| C | 7 | 247 | 7709639 | 5021.36 | 3953 | 3805 | 1534.6 |
| D | 3 | 254 | 8296155 | 4505.85 | 7166 | 6969 | 1839.6 |
| D | 7 | 223 | 6736261 | 3657.92 | 7166 | 6969 | 1839.6 |
| D | 3 | 184 | 2972321 | 1611.91 | 7166 | 6969 | 1839.6 |
Histogram calculated using DETX and DETY for each event in the final _common_clean file
| Quadrant A | 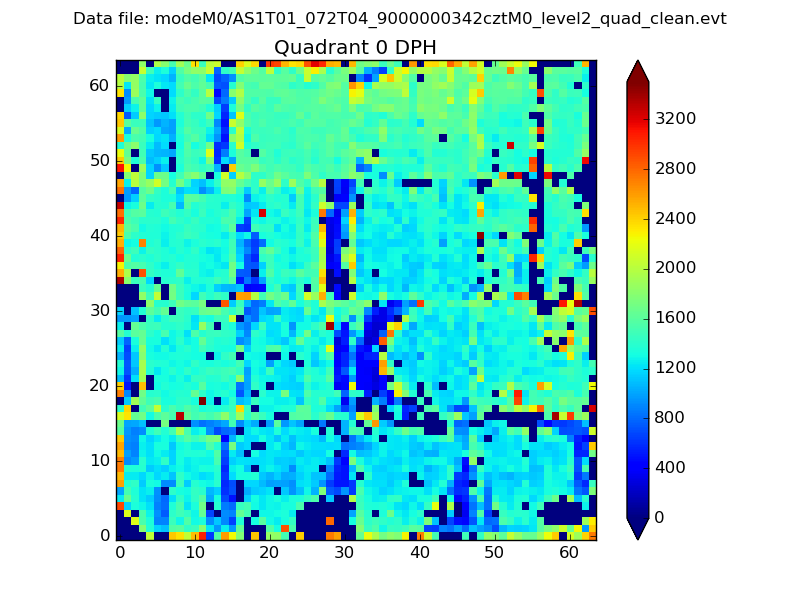 |
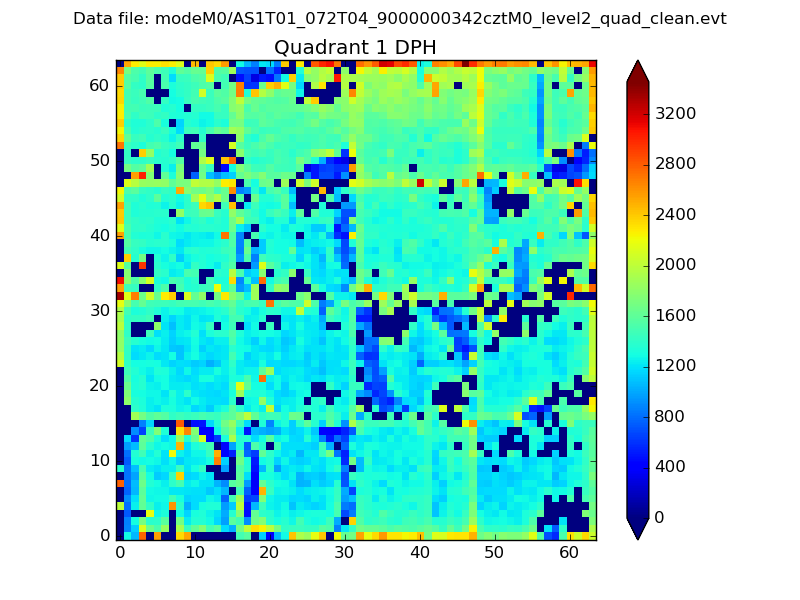 |
Quadrant B |
|---|---|---|---|
| Quadrant D |  |
 |
Quadrant C |
| Plot type | Count rate plots | Images |
|---|---|---|
| Comparison with Poisson distribution Blue bars denote a histogram of data divided into 1 sec bins. Red curve is a Poisson curve with rate = median count rate of data. |
 |
 |
| Quadrant-wise count rates Data is divided into 100 sec bins |
 |
|
| Module-wise count rates for Quadrant A Data is divided into 100 sec bins |
 |
 |
| Module-wise count rates for Quadrant B Data is divided into 100 sec bins |
 |
 |
| Module-wise count rates for Quadrant C Data is divided into 100 sec bins |
 |
 |
| Module-wise count rates for Quadrant D Data is divided into 100 sec bins |
 |
 |
| Parameter | Plot |
|---|---|
| CZT HV Monitor |  |
| D_VDD |  |
| Temperature 1 |  |
| Veto HV Monitor | 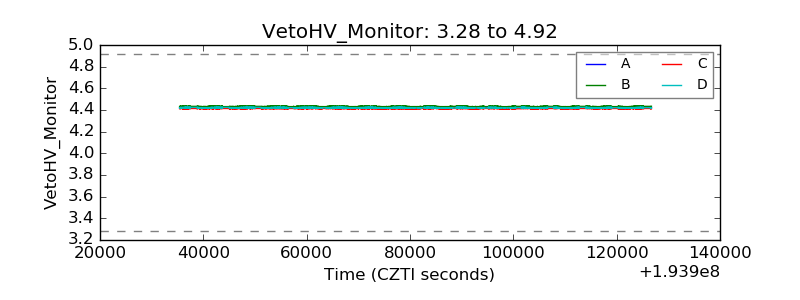 |
| Veto LLD |  |
| Alpha Counter |  |
| _CPM_Rate | 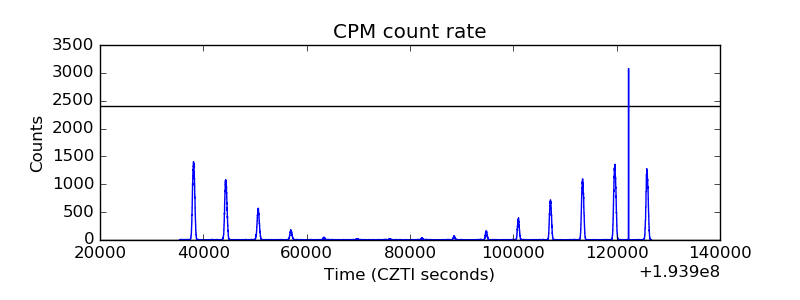 |
| CZT Counter |  |
| +2.5 Volts monitor |  |
| +5 Volts monitor |  |
| _ROLL_ROT |  |
| _Roll_DEC |  |
| _Roll_RA | 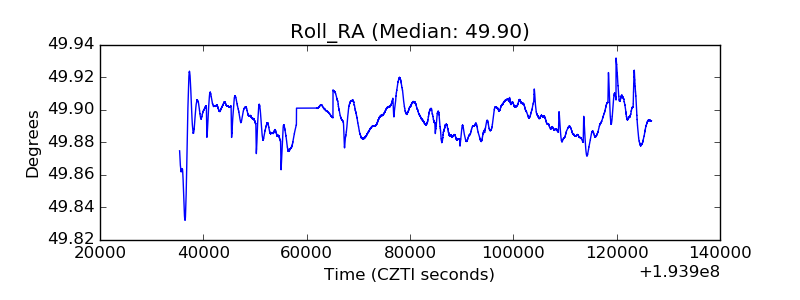 |
| Veto Counter |  |