| Param | Original file | Final file |
|---|---|---|
| Filename | modeM0/AS1T01_072T03_9000000340cztM0_level2.evt | modeM0/AS1T01_072T03_9000000340cztM0_level2_quad_clean.evt |
| Size (bytes) | 11,853,391,680 | 1,468,969,920 |
| Size | 11.0 GB | 1.4 GB |
| Events in quadrant A | 63,564,760 | 9,490,027 |
| Events in quadrant B | 88,860,594 | 9,410,187 |
| Events in quadrant C | 118,219,524 | 8,045,907 |
| Events in quadrant D | 79,722,528 | 8,763,460 |
| Mode SS | |||
|---|---|---|---|
| Quadrant | BADHDUFLAG | Total packets | Discarded packets |
| A | 0 | 2642 | 0 |
| B | 0 | 2642 | 0 |
| C | 0 | 2642 | 0 |
| D | 0 | 2642 | 0 |
| Mode M9 | |||
|---|---|---|---|
| Quadrant | BADHDUFLAG | Total packets | Discarded packets |
| A | 0 | 166 | 0 |
| B | 0 | 166 | 0 |
| C | 0 | 166 | 0 |
| D | 0 | 166 | 0 |
| Mode M0 | |||
|---|---|---|---|
| Quadrant | BADHDUFLAG | Total packets | Discarded packets |
| A | 0 | 287922 | 0 |
| B | 0 | 357898 | 0 |
| C | 0 | 445371 | 0 |
| D | 0 | 337318 | 0 |
| Quadrant | Total seconds | Saturated seconds | Saturation percentage |
|---|---|---|---|
| A | 129141 | 1586 | 1.228115% |
| B | 129298 | 6065 | 4.690714% |
| C | 129177 | 28558 | 22.107651% |
| D | 124311 | 10788 | 8.678234% |
Noise dominated data is calculated using 1-second bins in cleaned event files. If a bin has >2000 counts, and if more than 50% of those come from <1% of pixels, then it is considered to be noise-dominated and hence unusable.
| Quadrant | # 1 sec bins | Bins with >0 counts | Bins with >2000 counts | High rate bins dominated by noise | Noise dominated (total time) | Noise dominated (detector-on time) | Marked lightcurve |
|---|---|---|---|---|---|---|---|
| A | 146422 | 129152 | 156 | 156 | 0.11% | 0.12% |  |
| B | 146422 | 129309 | 7026 | 7026 | 4.80% | 5.43% |  |
| C | 146422 | 129190 | 27042 | 27042 | 18.47% | 20.93% |  |
| D | 146422 | 124325 | 11015 | 11015 | 7.52% | 8.86% |  |
Top three noisy pixels from each quadrant. If the there are fewer than three noisy pixels in the level2.evt file, extra rows are filled as -1
| Pixel properties | Quadrant properties | ||||||
|---|---|---|---|---|---|---|---|
| Quadrant | DetID | PixID | Counts | Sigma | Mean | Median | Sigma |
| A | 3 | 127 | 4959213 | 1709.2 | 14574 | 14282 | 2893.1 |
| A | 15 | 175 | 1131132 | 386.04 | 14574 | 14282 | 2893.1 |
| A | 0 | 1 | 335192 | 110.92 | 14574 | 14282 | 2893.1 |
| B | 7 | 30 | 16625308 | 5978.14 | 14818 | 14484 | 2778.6 |
| B | 3 | 254 | 4500621 | 1614.54 | 14818 | 14484 | 2778.6 |
| B | 5 | 68 | 2276872 | 814.22 | 14818 | 14484 | 2778.6 |
| C | 3 | 143 | 19558308 | 6673.65 | 12552 | 12655 | 2928.8 |
| C | 3 | 14 | 11081980 | 3779.5 | 12552 | 12655 | 2928.8 |
| C | 3 | 63 | 8515108 | 2903.07 | 12552 | 12655 | 2928.8 |
| D | 3 | 191 | 21663562 | 7005.81 | 13289 | 13012 | 3090.4 |
| D | 7 | 111 | 2011037 | 646.53 | 13289 | 13012 | 3090.4 |
| D | 7 | 85 | 1586697 | 509.22 | 13289 | 13012 | 3090.4 |
Histogram calculated using DETX and DETY for each event in the final _common_clean file
| Quadrant A |  |
 |
Quadrant B |
|---|---|---|---|
| Quadrant D |  |
 |
Quadrant C |
| Plot type | Count rate plots | Images |
|---|---|---|
| Comparison with Poisson distribution Blue bars denote a histogram of data divided into 1 sec bins. Red curve is a Poisson curve with rate = median count rate of data. |
 |
 |
| Quadrant-wise count rates Data is divided into 100 sec bins |
 |
|
| Module-wise count rates for Quadrant A Data is divided into 100 sec bins |
 |
 |
| Module-wise count rates for Quadrant B Data is divided into 100 sec bins |
 |
 |
| Module-wise count rates for Quadrant C Data is divided into 100 sec bins |
 |
 |
| Module-wise count rates for Quadrant D Data is divided into 100 sec bins |
 |
 |
| Parameter | Plot |
|---|---|
| CZT HV Monitor |  |
| D_VDD |  |
| Temperature 1 |  |
| Veto HV Monitor |  |
| Veto LLD |  |
| Alpha Counter | 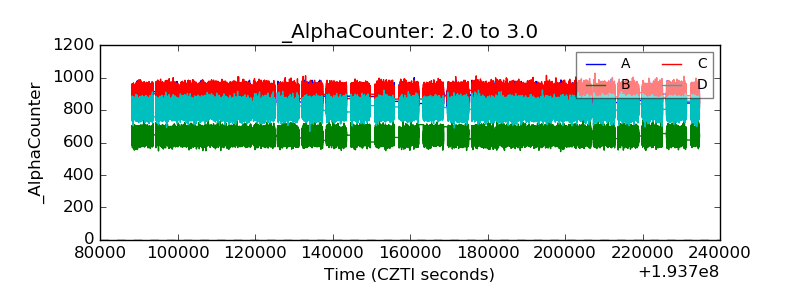 |
| _CPM_Rate | 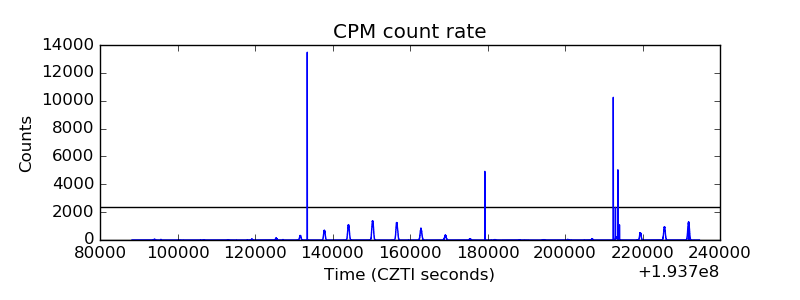 |
| CZT Counter |  |
| +2.5 Volts monitor |  |
| +5 Volts monitor | 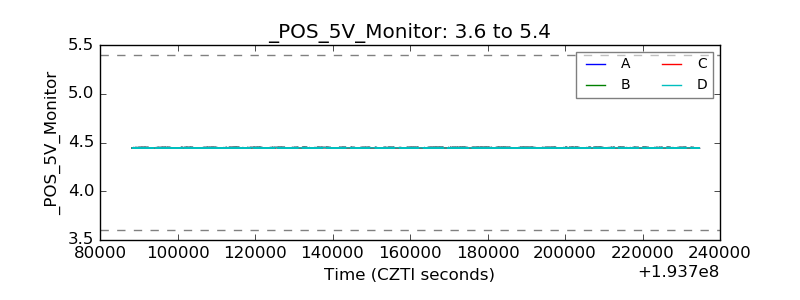 |
| _ROLL_ROT |  |
| _Roll_DEC |  |
| _Roll_RA | 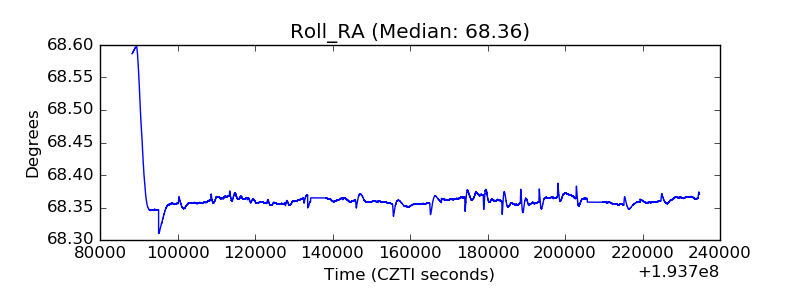 |
| Veto Counter |  |