| Param | Original file | Final file |
|---|---|---|
| Filename | modeM0/AS1T01_072T01_9000000338cztM0_level2.evt | modeM0/AS1T01_072T01_9000000338cztM0_level2_quad_clean.evt |
| Size (bytes) | 6,004,336,320 | 1,203,972,480 |
| Size | 5.6 GB | 1.1 GB |
| Events in quadrant A | 41,710,472 | 7,396,664 |
| Events in quadrant B | 43,729,453 | 7,564,625 |
| Events in quadrant C | 47,608,303 | 7,467,149 |
| Events in quadrant D | 42,117,000 | 7,268,881 |
| Mode M9 | |||
|---|---|---|---|
| Quadrant | BADHDUFLAG | Total packets | Discarded packets |
| A | 0 | 26 | 0 |
| B | 1 | 26 | 0 |
| C | 1 | 26 | 0 |
| D | 1 | 1 | 0 |
| Mode SS | |||
|---|---|---|---|
| Quadrant | BADHDUFLAG | Total packets | Discarded packets |
| A | 0 | 1976 | 0 |
| B | 0 | 1976 | 0 |
| C | 0 | 1976 | 0 |
| D | 0 | 1976 | 0 |
| Mode M0 | |||
|---|---|---|---|
| Quadrant | BADHDUFLAG | Total packets | Discarded packets |
| A | 0 | 202909 | 0 |
| B | 0 | 204807 | 0 |
| C | 0 | 217869 | 0 |
| D | 0 | 208659 | 0 |
| Quadrant | Total seconds | Saturated seconds | Saturation percentage |
|---|---|---|---|
| A | 98801 | 620 | 0.627524% |
| B | 98797 | 701 | 0.709536% |
| C | 98797 | 1339 | 1.355304% |
| D | 98801 | 713 | 0.721653% |
Noise dominated data is calculated using 1-second bins in cleaned event files. If a bin has >2000 counts, and if more than 50% of those come from <1% of pixels, then it is considered to be noise-dominated and hence unusable.
| Quadrant | # 1 sec bins | Bins with >0 counts | Bins with >2000 counts | High rate bins dominated by noise | Noise dominated (total time) | Noise dominated (detector-on time) | Marked lightcurve |
|---|---|---|---|---|---|---|---|
| A | 114892 | 98811 | 72 | 72 | 0.06% | 0.07% |  |
| B | 114892 | 98809 | 168 | 168 | 0.15% | 0.17% |  |
| C | 114892 | 98808 | 1021 | 1021 | 0.89% | 1.03% |  |
| D | 114892 | 98810 | 533 | 533 | 0.46% | 0.54% | 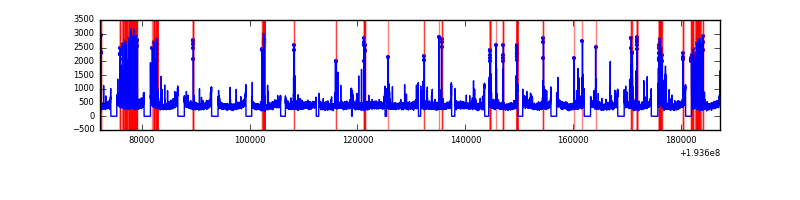 |
Top three noisy pixels from each quadrant. If the there are fewer than three noisy pixels in the level2.evt file, extra rows are filled as -1
| Pixel properties | Quadrant properties | ||||||
|---|---|---|---|---|---|---|---|
| Quadrant | DetID | PixID | Counts | Sigma | Mean | Median | Sigma |
| A | 14 | 5 | 396372 | 185.26 | 10699 | 10548 | 2082.6 |
| A | 0 | 1 | 136358 | 60.41 | 10699 | 10548 | 2082.6 |
| A | 15 | 191 | 75826 | 31.34 | 10699 | 10548 | 2082.6 |
| B | 4 | 48 | 409674 | 199.99 | 11081 | 10874 | 1994.1 |
| B | 6 | 36 | 403134 | 196.71 | 11081 | 10874 | 1994.1 |
| B | 5 | 68 | 243436 | 116.63 | 11081 | 10874 | 1994.1 |
| C | 9 | 85 | 4349898 | 1909.63 | 10424 | 10491 | 2272.4 |
| C | 2 | 53 | 1779658 | 778.55 | 10424 | 10491 | 2272.4 |
| C | 10 | 82 | 419657 | 180.06 | 10424 | 10491 | 2272.4 |
| D | 10 | 215 | 1236523 | 530.85 | 10299 | 10079 | 2310.4 |
| D | 2 | 152 | 694270 | 296.14 | 10299 | 10079 | 2310.4 |
| D | 2 | 31 | 339540 | 142.6 | 10299 | 10079 | 2310.4 |
Histogram calculated using DETX and DETY for each event in the final _common_clean file
| Quadrant A |  |
 |
Quadrant B |
|---|---|---|---|
| Quadrant D |  |
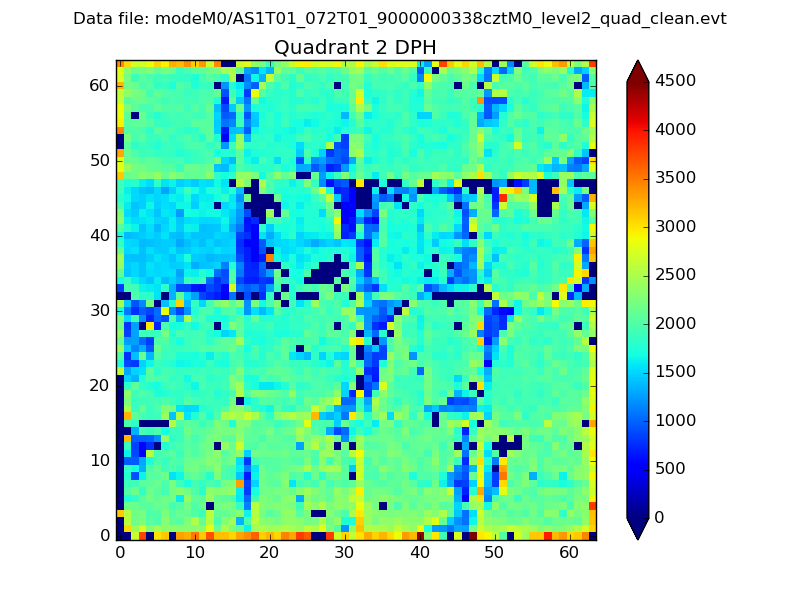 |
Quadrant C |
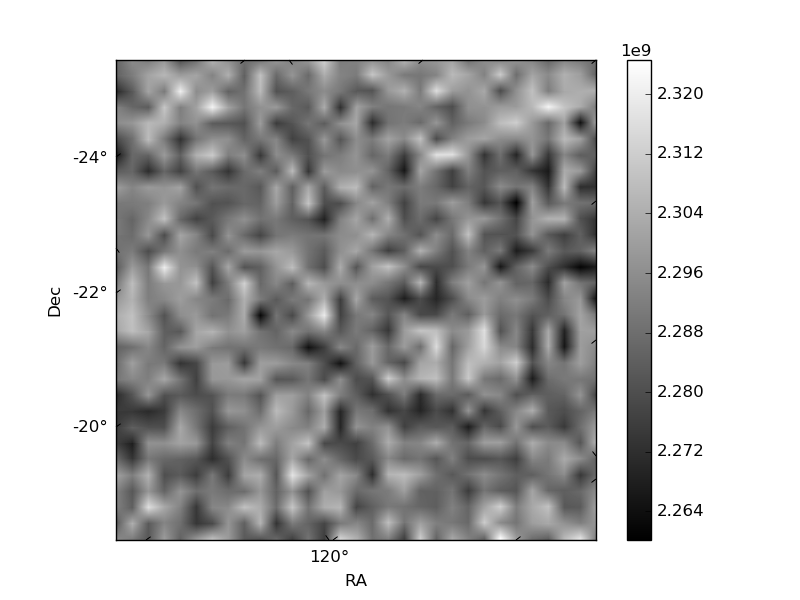
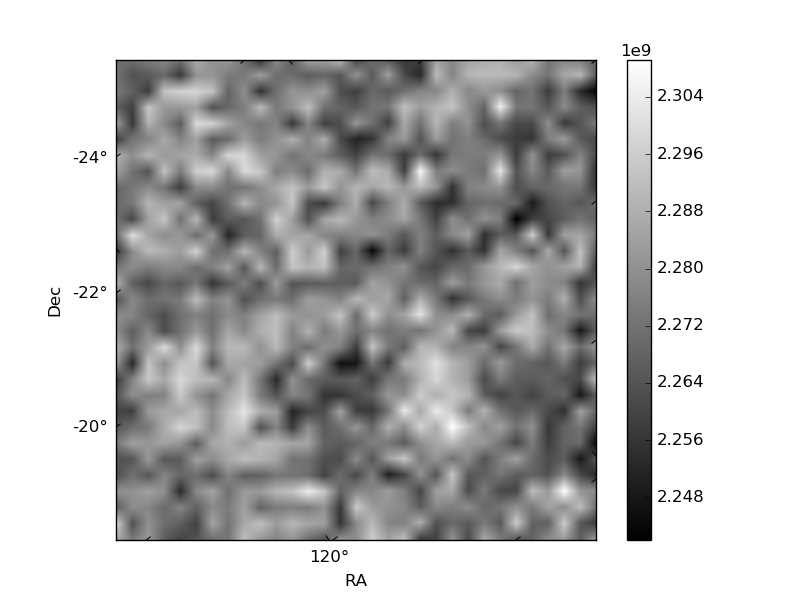
| Plot type | Count rate plots | Images |
|---|---|---|
| Comparison with Poisson distribution Blue bars denote a histogram of data divided into 1 sec bins. Red curve is a Poisson curve with rate = median count rate of data. |
 |
 |
| Quadrant-wise count rates Data is divided into 100 sec bins |
 |
|
| Module-wise count rates for Quadrant A Data is divided into 100 sec bins |
 |
 |
| Module-wise count rates for Quadrant B Data is divided into 100 sec bins |
 |
 |
| Module-wise count rates for Quadrant C Data is divided into 100 sec bins |
 |
 |
| Module-wise count rates for Quadrant D Data is divided into 100 sec bins |
 |
 |
| Parameter | Plot |
|---|---|
| CZT HV Monitor |  |
| D_VDD |  |
| Temperature 1 |  |
| Veto HV Monitor |  |
| Veto LLD |  |
| Alpha Counter |  |
| _CPM_Rate |  |
| CZT Counter |  |
| +2.5 Volts monitor |  |
| +5 Volts monitor |  |
| _ROLL_ROT | 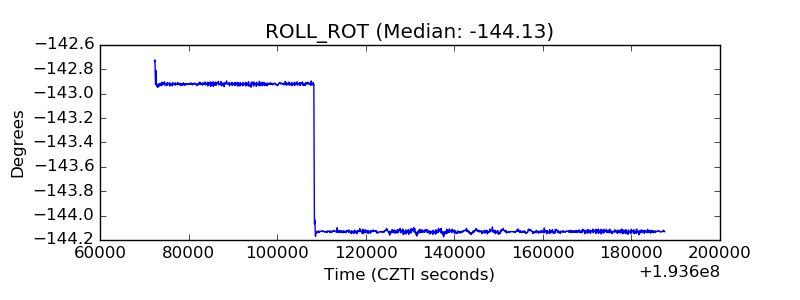 |
| _Roll_DEC |  |
| _Roll_RA |  |
| Veto Counter | 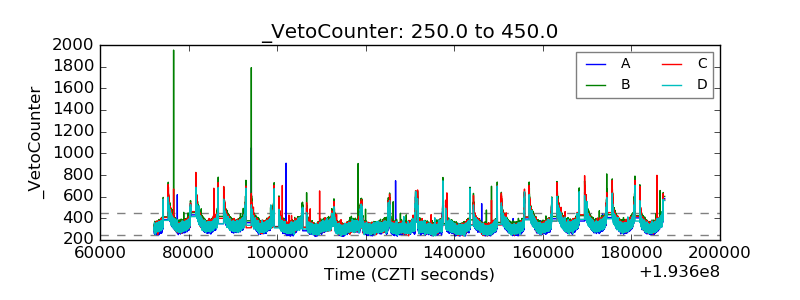 |