| Param | Original file | Final file |
|---|---|---|
| Filename | modeM0/AS1T01_072T02_9000000336cztM0_level2.evt | modeM0/AS1T01_072T02_9000000336cztM0_level2_quad_clean.evt |
| Size (bytes) | 5,812,217,280 | 1,175,932,800 |
| Size | 5.4 GB | 1.1 GB |
| Events in quadrant A | 42,585,954 | 7,296,508 |
| Events in quadrant B | 46,061,502 | 7,441,233 |
| Events in quadrant C | 40,166,961 | 7,213,972 |
| Events in quadrant D | 40,697,091 | 7,064,355 |
| Mode M9 | |||
|---|---|---|---|
| Quadrant | BADHDUFLAG | Total packets | Discarded packets |
| A | 0 | 16 | 0 |
| B | 1 | 16 | 0 |
| C | 1 | 16 | 0 |
| D | 1 | 1 | 0 |
| Mode M0 | |||
|---|---|---|---|
| Quadrant | BADHDUFLAG | Total packets | Discarded packets |
| A | 0 | 204487 | 0 |
| B | 0 | 207774 | 0 |
| C | 0 | 196782 | 0 |
| D | 0 | 202769 | 0 |
| Mode SS | |||
|---|---|---|---|
| Quadrant | BADHDUFLAG | Total packets | Discarded packets |
| A | 0 | 1930 | 0 |
| B | 0 | 1930 | 0 |
| C | 0 | 1930 | 0 |
| D | 0 | 1930 | 0 |
| Quadrant | Total seconds | Saturated seconds | Saturation percentage |
|---|---|---|---|
| A | 96334 | 1676 | 1.739780% |
| B | 96332 | 548 | 0.568866% |
| C | 96332 | 311 | 0.322842% |
| D | 96332 | 961 | 0.997592% |
Noise dominated data is calculated using 1-second bins in cleaned event files. If a bin has >2000 counts, and if more than 50% of those come from <1% of pixels, then it is considered to be noise-dominated and hence unusable.
| Quadrant | # 1 sec bins | Bins with >0 counts | Bins with >2000 counts | High rate bins dominated by noise | Noise dominated (total time) | Noise dominated (detector-on time) | Marked lightcurve |
|---|---|---|---|---|---|---|---|
| A | 110106 | 96353 | 534 | 534 | 0.48% | 0.55% |  |
| B | 110106 | 96352 | 53 | 53 | 0.05% | 0.06% |  |
| C | 110106 | 96352 | 32 | 32 | 0.03% | 0.03% |  |
| D | 110106 | 96352 | 738 | 738 | 0.67% | 0.77% |  |
Top three noisy pixels from each quadrant. If the there are fewer than three noisy pixels in the level2.evt file, extra rows are filled as -1
| Pixel properties | Quadrant properties | ||||||
|---|---|---|---|---|---|---|---|
| Quadrant | DetID | PixID | Counts | Sigma | Mean | Median | Sigma |
| A | 15 | 171 | 2914016 | 1480.63 | 10133 | 9967 | 1961.4 |
| A | 0 | 247 | 513193 | 256.57 | 10133 | 9967 | 1961.4 |
| A | 0 | 1 | 85594 | 38.56 | 10133 | 9967 | 1961.4 |
| B | 5 | 68 | 4436548 | 2345.47 | 10538 | 10334 | 1887.1 |
| B | 0 | 234 | 614071 | 319.92 | 10538 | 10334 | 1887.1 |
| B | 0 | 198 | 199109 | 100.03 | 10538 | 10334 | 1887.1 |
| C | 9 | 85 | 519145 | 234.83 | 10004 | 10055 | 2168.0 |
| C | 10 | 82 | 191830 | 83.85 | 10004 | 10055 | 2168.0 |
| C | 10 | 34 | 82385 | 33.36 | 10004 | 10055 | 2168.0 |
| D | 2 | 31 | 1986680 | 892.3 | 9896 | 9677 | 2215.6 |
| D | 13 | 53 | 312013 | 136.46 | 9896 | 9677 | 2215.6 |
| D | 10 | 199 | 284032 | 123.83 | 9896 | 9677 | 2215.6 |
Histogram calculated using DETX and DETY for each event in the final _common_clean file
| Quadrant A |  |
 |
Quadrant B |
|---|---|---|---|
| Quadrant D | 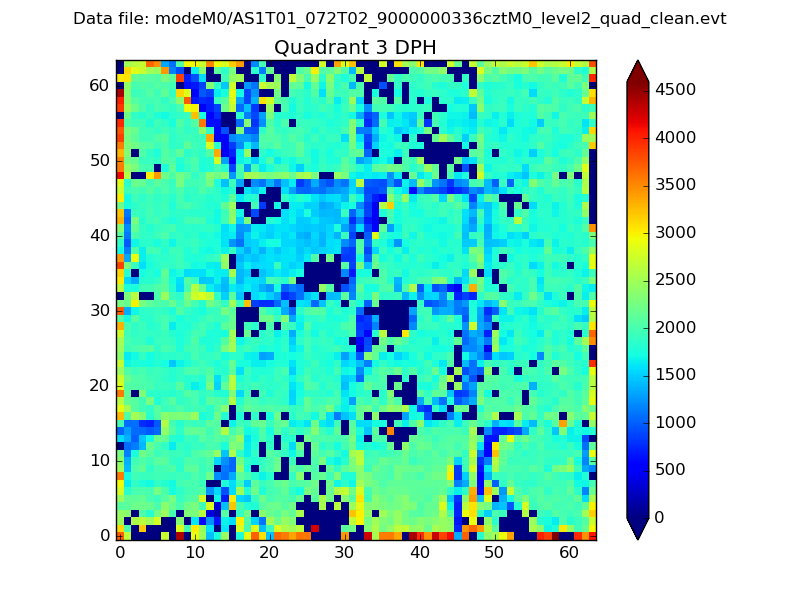 |
 |
Quadrant C |
| Plot type | Count rate plots | Images |
|---|---|---|
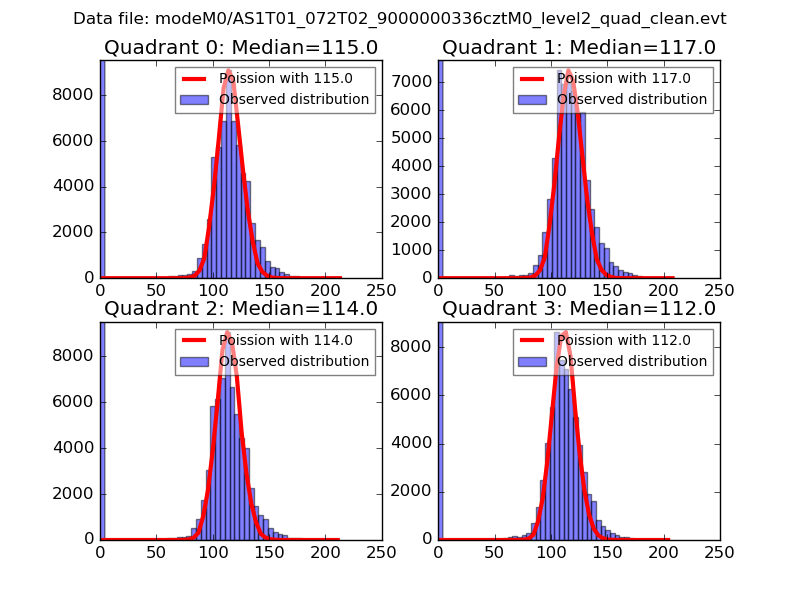
| Comparison with Poisson distribution Blue bars denote a histogram of data divided into 1 sec bins. Red curve is a Poisson curve with rate = median count rate of data. |
 |
 |
| Quadrant-wise count rates Data is divided into 100 sec bins |
 |
|
| Module-wise count rates for Quadrant A Data is divided into 100 sec bins |
 |
 |
| Module-wise count rates for Quadrant B Data is divided into 100 sec bins |
 |
 |
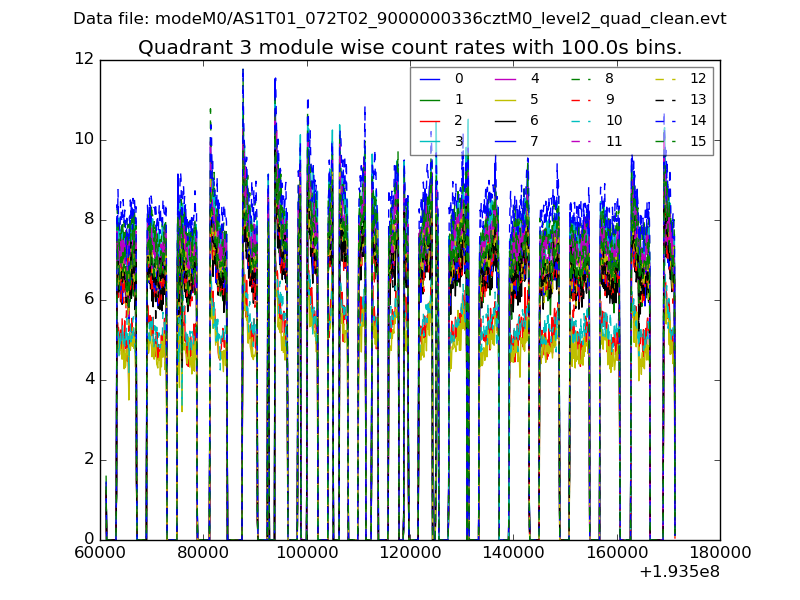
| Module-wise count rates for Quadrant C Data is divided into 100 sec bins |
 |
 |
| Module-wise count rates for Quadrant D Data is divided into 100 sec bins |
 |
 |
| Parameter | Plot |
|---|---|
| CZT HV Monitor |  |
| D_VDD |  |
| Temperature 1 | 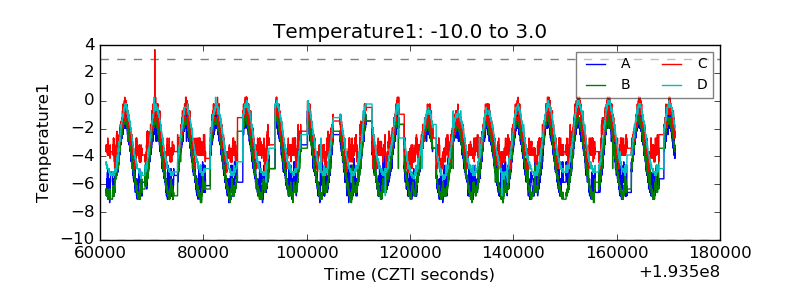 |
| Veto HV Monitor |  |
| Veto LLD |  |
| Alpha Counter |  |
| _CPM_Rate |  |
| CZT Counter |  |
| +2.5 Volts monitor |  |
| +5 Volts monitor |  |
| _ROLL_ROT |  |
| _Roll_DEC |  |
| _Roll_RA |  |
| Veto Counter |  |