| Param | Original file | Final file |
|---|---|---|
| Filename | modeM0/AS1T01_051T01_9000000332cztM0_level2_bc.evt | modeM0/AS1T01_051T01_9000000332cztM0_level2_quad_clean.evt |
| Size (bytes) | 607,576,320 | 318,790,080 |
| Size | 579.4 MB | 304.0 MB |
| Events in quadrant A | 4,947,693 | 2,072,771 |
| Events in quadrant B | 4,143,066 | 2,079,135 |
| Events in quadrant C | 3,760,383 | 2,068,461 |
| Events in quadrant D | 4,154,404 | 2,033,840 |
| Mode M0 | |||
|---|---|---|---|
| Quadrant | BADHDUFLAG | Total packets | Discarded packets |
| A | 0 | 45229 | 0 |
| B | 0 | 42122 | 0 |
| C | 0 | 41665 | 0 |
| D | 0 | 42726 | 0 |
| Mode SS | |||
|---|---|---|---|
| Quadrant | BADHDUFLAG | Total packets | Discarded packets |
| A | 0 | 406 | 0 |
| B | 0 | 406 | 0 |
| C | 0 | 406 | 0 |
| D | 0 | 406 | 0 |
| Mode M9 | |||
|---|---|---|---|
| Quadrant | BADHDUFLAG | Total packets | Discarded packets |
| A | 0 | 4 | 0 |
| B | 1 | 4 | 0 |
| C | 1 | 4 | 0 |
| D | 1 | 1 | 0 |
| Quadrant | Total seconds | Saturated seconds | Saturation percentage |
|---|---|---|---|
| A | 20364 | 407 | 1.998625% |
| B | 20364 | 102 | 0.500884% |
| C | 20364 | 95 | 0.466510% |
| D | 20364 | 166 | 0.815164% |
Noise dominated data is calculated using 1-second bins in cleaned event files. If a bin has >2000 counts, and if more than 50% of those come from <1% of pixels, then it is considered to be noise-dominated and hence unusable.
| Quadrant | # 1 sec bins | Bins with >0 counts | Bins with >2000 counts | High rate bins dominated by noise | Noise dominated (total time) | Noise dominated (detector-on time) | Marked lightcurve |
|---|---|---|---|---|---|---|---|
| A | 23175 | 20365 | 137 | 137 | 0.59% | 0.67% |  |
| B | 23175 | 20365 | 0 | 0 | 0.00% | 0.00% | 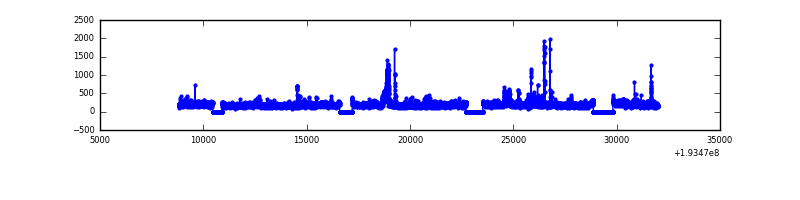 |
| C | 23175 | 20365 | 0 | 0 | 0.00% | 0.00% |  |
| D | 23175 | 20365 | 11 | 11 | 0.05% | 0.05% |  |
Top three noisy pixels from each quadrant. If the there are fewer than three noisy pixels in the level2.evt file, extra rows are filled as -1
| Pixel properties | Quadrant properties | ||||||
|---|---|---|---|---|---|---|---|
| Quadrant | DetID | PixID | Counts | Sigma | Mean | Median | Sigma |
| A | 14 | 5 | 744333 | 3802.74 | 914 | 894 | 195.5 |
| A | 0 | 231 | 524078 | 2676.12 | 914 | 894 | 195.5 |
| A | 0 | 199 | 124810 | 633.84 | 914 | 894 | 195.5 |
| B | 0 | 234 | 250642 | 1487.58 | 929 | 900 | 167.9 |
| B | 5 | 68 | 112061 | 662.13 | 929 | 900 | 167.9 |
| B | 0 | 198 | 100262 | 591.85 | 929 | 900 | 167.9 |
| C | 5 | 234 | 89256 | 458.29 | 905 | 887 | 192.8 |
| C | 10 | 82 | 33869 | 171.05 | 905 | 887 | 192.8 |
| C | 12 | 4 | 23347 | 116.48 | 905 | 887 | 192.8 |
| D | 2 | 31 | 271132 | 1362.67 | 902 | 874 | 198.3 |
| D | 13 | 88 | 145127 | 727.34 | 902 | 874 | 198.3 |
| D | 9 | 64 | 80068 | 399.31 | 902 | 874 | 198.3 |
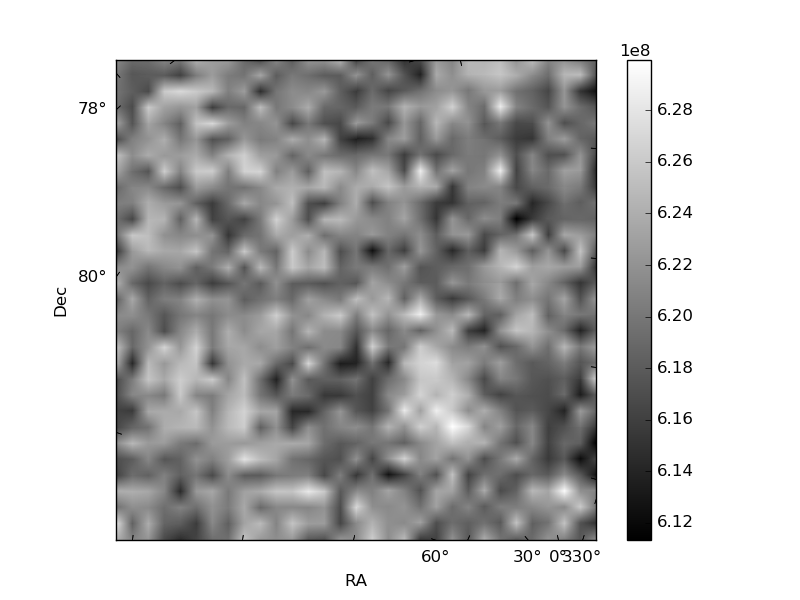
Histogram calculated using DETX and DETY for each event in the final _common_clean file
| Quadrant A | 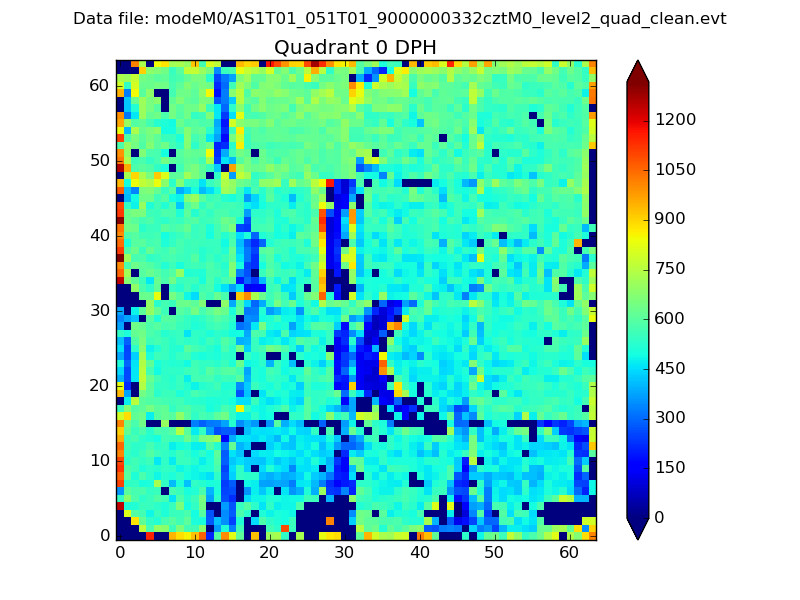 |
 |
Quadrant B |
|---|---|---|---|
| Quadrant D |  |
 |
Quadrant C |
| Plot type | Count rate plots | Images |
|---|---|---|
| Comparison with Poisson distribution Blue bars denote a histogram of data divided into 1 sec bins. Red curve is a Poisson curve with rate = median count rate of data. |
 |
 |
| Quadrant-wise count rates Data is divided into 100 sec bins |
 |
|
| Module-wise count rates for Quadrant A Data is divided into 100 sec bins |
 |
 |
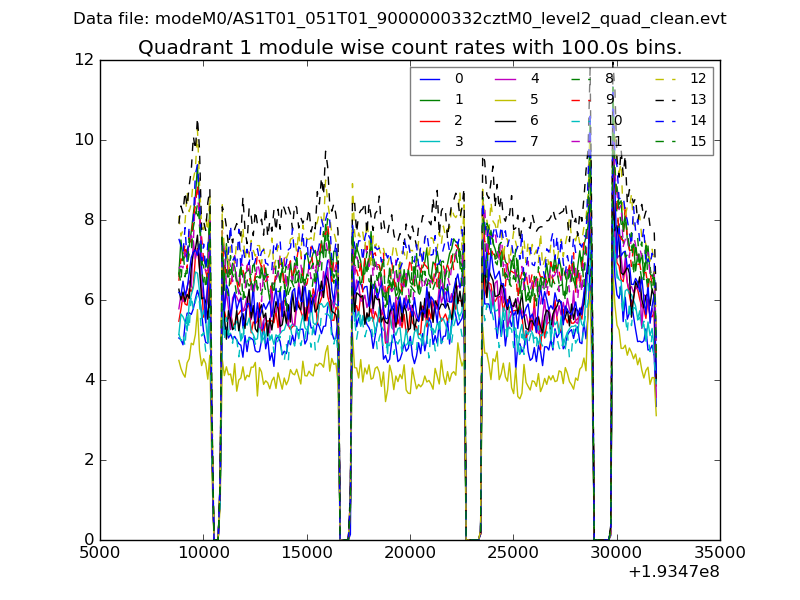
| Module-wise count rates for Quadrant B Data is divided into 100 sec bins |
 |
 |
| Module-wise count rates for Quadrant C Data is divided into 100 sec bins |
 |
 |
| Module-wise count rates for Quadrant D Data is divided into 100 sec bins |
 |
 |
| Parameter | Plot |
|---|---|
| CZT HV Monitor | 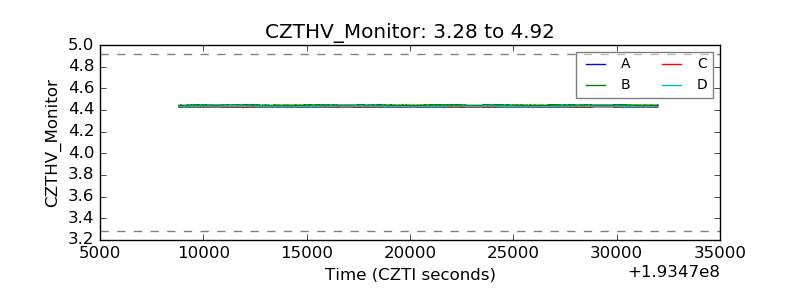 |
| D_VDD |  |
| Temperature 1 |  |
| Veto HV Monitor |  |
| Veto LLD |  |
| Alpha Counter |  |
| _CPM_Rate | 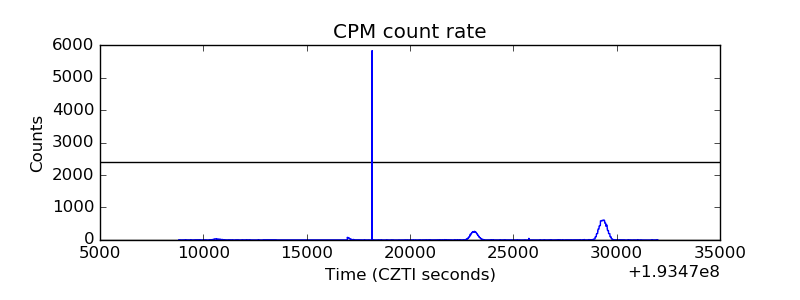 |
| CZT Counter | 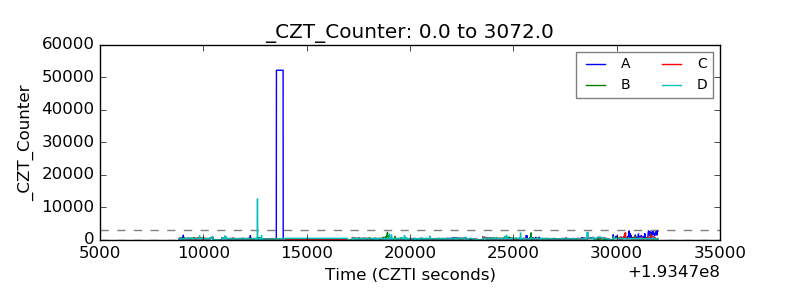 |
| +2.5 Volts monitor | 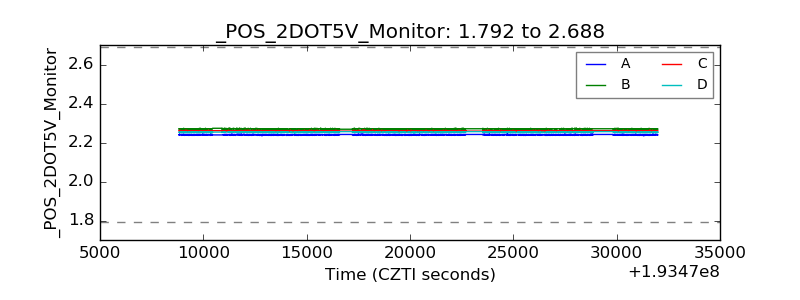 |
| +5 Volts monitor |  |
| _ROLL_ROT |  |
| _Roll_DEC |  |
| _Roll_RA |  |
| Veto Counter |  |