| Param | Original file | Final file |
|---|---|---|
| Filename | modeM0/AS1T01_034T01_9000000334cztM0_level2_bc.evt | modeM0/AS1T01_034T01_9000000334cztM0_level2_quad_clean.evt |
| Size (bytes) | 1,530,020,160 | 794,378,880 |
| Size | 1.4 GB | 757.6 MB |
| Events in quadrant A | 12,357,251 | 5,085,339 |
| Events in quadrant B | 10,469,863 | 5,198,245 |
| Events in quadrant C | 9,440,586 | 5,239,252 |
| Events in quadrant D | 10,606,931 | 5,059,930 |
| Mode SS | |||
|---|---|---|---|
| Quadrant | BADHDUFLAG | Total packets | Discarded packets |
| A | 0 | 1018 | 0 |
| B | 0 | 1018 | 0 |
| C | 0 | 1018 | 0 |
| D | 0 | 1018 | 0 |
| Mode M0 | |||
|---|---|---|---|
| Quadrant | BADHDUFLAG | Total packets | Discarded packets |
| A | 0 | 113423 | 0 |
| B | 0 | 105537 | 0 |
| C | 0 | 103072 | 0 |
| D | 0 | 108723 | 0 |
| Mode M9 | |||
|---|---|---|---|
| Quadrant | BADHDUFLAG | Total packets | Discarded packets |
| A | 0 | 9 | 0 |
| B | 1 | 9 | 0 |
| C | 1 | 9 | 0 |
| D | 1 | 9 | 0 |
| Quadrant | Total seconds | Saturated seconds | Saturation percentage |
|---|---|---|---|
| A | 50719 | 644 | 1.269741% |
| B | 50719 | 133 | 0.262229% |
| C | 50721 | 144 | 0.283906% |
| D | 50721 | 626 | 1.234203% |
Noise dominated data is calculated using 1-second bins in cleaned event files. If a bin has >2000 counts, and if more than 50% of those come from <1% of pixels, then it is considered to be noise-dominated and hence unusable.
| Quadrant | # 1 sec bins | Bins with >0 counts | Bins with >2000 counts | High rate bins dominated by noise | Noise dominated (total time) | Noise dominated (detector-on time) | Marked lightcurve |
|---|---|---|---|---|---|---|---|
| A | 58207 | 50724 | 142 | 142 | 0.24% | 0.28% |  |
| B | 58207 | 50724 | 1 | 1 | 0.00% | 0.00% |  |
| C | 58207 | 50723 | 4 | 4 | 0.01% | 0.01% |  |
| D | 58207 | 50723 | 117 | 117 | 0.20% | 0.23% | 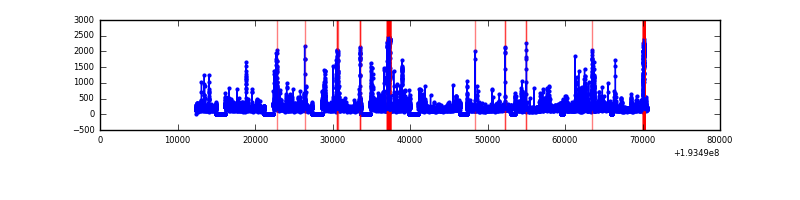 |
Top three noisy pixels from each quadrant. If the there are fewer than three noisy pixels in the level2.evt file, extra rows are filled as -1
| Pixel properties | Quadrant properties | ||||||
|---|---|---|---|---|---|---|---|
| Quadrant | DetID | PixID | Counts | Sigma | Mean | Median | Sigma |
| A | 0 | 231 | 1386058 | 2935.45 | 2252 | 2205 | 471.4 |
| A | 0 | 199 | 1185706 | 2510.46 | 2252 | 2205 | 471.4 |
| A | 15 | 171 | 648314 | 1370.53 | 2252 | 2205 | 471.4 |
| B | 5 | 68 | 882809 | 2146.72 | 2327 | 2261 | 410.2 |
| B | 0 | 234 | 216541 | 522.4 | 2327 | 2261 | 410.2 |
| B | 0 | 198 | 181416 | 436.77 | 2327 | 2261 | 410.2 |
| C | 10 | 82 | 158427 | 327.39 | 2280 | 2243 | 477.1 |
| C | 10 | 34 | 61665 | 124.56 | 2280 | 2243 | 477.1 |
| C | 1 | 192 | 56773 | 114.3 | 2280 | 2243 | 477.1 |
| D | 2 | 31 | 675538 | 1378.18 | 2249 | 2180 | 488.6 |
| D | 13 | 174 | 445348 | 907.04 | 2249 | 2180 | 488.6 |
| D | 13 | 88 | 276043 | 560.52 | 2249 | 2180 | 488.6 |
Histogram calculated using DETX and DETY for each event in the final _common_clean file
| Quadrant A | 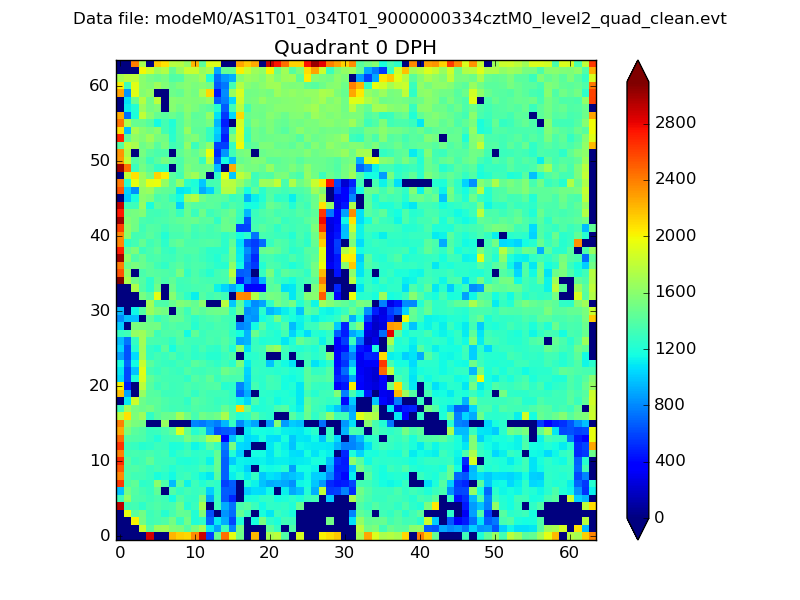 |
 |
Quadrant B |
|---|---|---|---|
| Quadrant D |  |
 |
Quadrant C |
| Plot type | Count rate plots | Images |
|---|---|---|
| Comparison with Poisson distribution Blue bars denote a histogram of data divided into 1 sec bins. Red curve is a Poisson curve with rate = median count rate of data. |
 |
 |
| Quadrant-wise count rates Data is divided into 100 sec bins |
 |
|
| Module-wise count rates for Quadrant A Data is divided into 100 sec bins |
 |
 |
| Module-wise count rates for Quadrant B Data is divided into 100 sec bins |
 |
 |
| Module-wise count rates for Quadrant C Data is divided into 100 sec bins |
 |
 |
| Module-wise count rates for Quadrant D Data is divided into 100 sec bins |
 |
 |
| Parameter | Plot |
|---|---|
| CZT HV Monitor |  |
| D_VDD |  |
| Temperature 1 |  |
| Veto HV Monitor |  |
| Veto LLD |  |
| Alpha Counter |  |
| _CPM_Rate |  |
| CZT Counter |  |
| +2.5 Volts monitor |  |
| +5 Volts monitor |  |
| _ROLL_ROT |  |
| _Roll_DEC |  |
| _Roll_RA |  |
| Veto Counter |  |