| Param | Original file | Final file |
|---|---|---|
| Filename | modeM0/AS1P01_069T01_9000000330cztM0_level2.evt | modeM0/AS1P01_069T01_9000000330cztM0_level2_quad_clean.evt |
| Size (bytes) | 1,409,958,720 | 365,693,760 |
| Size | 1.3 GB | 348.8 MB |
| Events in quadrant A | 10,262,091 | 2,367,119 |
| Events in quadrant B | 10,418,200 | 2,414,679 |
| Events in quadrant C | 10,053,906 | 2,363,379 |
| Events in quadrant D | 10,358,985 | 2,298,676 |
| Mode SS | |||
|---|---|---|---|
| Quadrant | BADHDUFLAG | Total packets | Discarded packets |
| A | 0 | 476 | 0 |
| B | 0 | 476 | 0 |
| C | 0 | 476 | 0 |
| D | 0 | 476 | 0 |
| Mode M9 | |||
|---|---|---|---|
| Quadrant | BADHDUFLAG | Total packets | Discarded packets |
| A | 0 | 3 | 0 |
| B | 1 | 3 | 0 |
| C | 1 | 3 | 0 |
| D | 1 | 1 | 0 |
| Mode M0 | |||
|---|---|---|---|
| Quadrant | BADHDUFLAG | Total packets | Discarded packets |
| A | 0 | 49765 | 0 |
| B | 0 | 49403 | 0 |
| C | 0 | 49367 | 0 |
| D | 0 | 50851 | 0 |
| Quadrant | Total seconds | Saturated seconds | Saturation percentage |
|---|---|---|---|
| A | 23737 | 391 | 1.647217% |
| B | 23737 | 285 | 1.200657% |
| C | 23737 | 256 | 1.078485% |
| D | 23736 | 223 | 0.939501% |
Noise dominated data is calculated using 1-second bins in cleaned event files. If a bin has >2000 counts, and if more than 50% of those come from <1% of pixels, then it is considered to be noise-dominated and hence unusable.
| Quadrant | # 1 sec bins | Bins with >0 counts | Bins with >2000 counts | High rate bins dominated by noise | Noise dominated (total time) | Noise dominated (detector-on time) | Marked lightcurve |
|---|---|---|---|---|---|---|---|
| A | 24654 | 23742 | 95 | 95 | 0.39% | 0.40% |  |
| B | 24654 | 23742 | 0 | 0 | 0.00% | 0.00% |  |
| C | 24654 | 23742 | 17 | 17 | 0.07% | 0.07% |  |
| D | 24654 | 23742 | 101 | 101 | 0.41% | 0.43% |  |
Top three noisy pixels from each quadrant. If the there are fewer than three noisy pixels in the level2.evt file, extra rows are filled as -1
| Pixel properties | Quadrant properties | ||||||
|---|---|---|---|---|---|---|---|
| Quadrant | DetID | PixID | Counts | Sigma | Mean | Median | Sigma |
| A | 0 | 199 | 338206 | 672.14 | 2563 | 2517 | 499.4 |
| A | 0 | 231 | 47334 | 89.73 | 2563 | 2517 | 499.4 |
| A | 0 | 128 | 20594 | 36.19 | 2563 | 2517 | 499.4 |
| B | 0 | 234 | 212775 | 436.69 | 2649 | 2590 | 481.3 |
| B | 5 | 68 | 57718 | 114.54 | 2649 | 2590 | 481.3 |
| B | 0 | 198 | 30247 | 57.46 | 2649 | 2590 | 481.3 |
| C | 5 | 234 | 91437 | 162.83 | 2515 | 2515 | 546.1 |
| C | 10 | 82 | 52968 | 92.39 | 2515 | 2515 | 546.1 |
| C | 10 | 65 | 19966 | 31.96 | 2515 | 2515 | 546.1 |
| D | 2 | 32 | 168470 | 297.62 | 2491 | 2431 | 557.9 |
| D | 2 | 31 | 163714 | 289.1 | 2491 | 2431 | 557.9 |
| D | 10 | 215 | 150807 | 265.96 | 2491 | 2431 | 557.9 |
Histogram calculated using DETX and DETY for each event in the final _common_clean file
| Quadrant A | 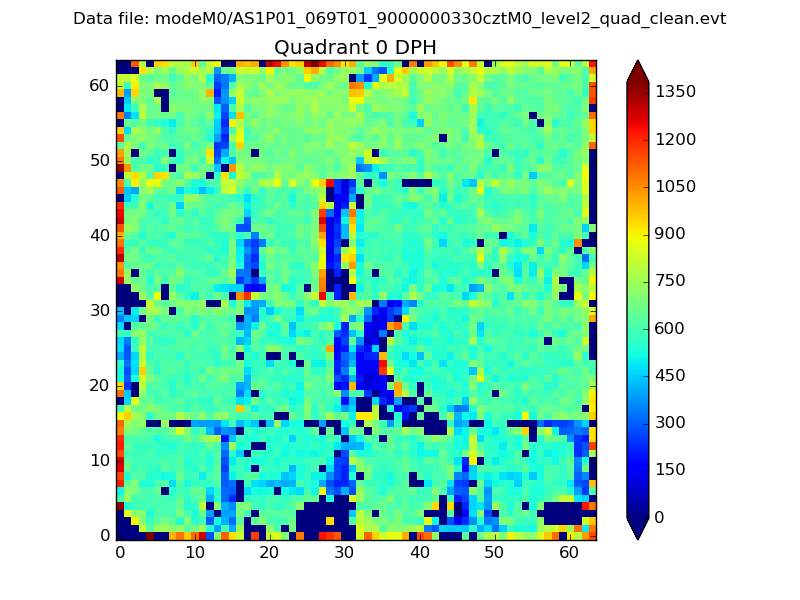 |
 |
Quadrant B |
|---|---|---|---|
| Quadrant D |  |
 |
Quadrant C |
| Plot type | Count rate plots | Images |
|---|---|---|
| Comparison with Poisson distribution Blue bars denote a histogram of data divided into 1 sec bins. Red curve is a Poisson curve with rate = median count rate of data. |
 |
 |
| Quadrant-wise count rates Data is divided into 100 sec bins |
 |
|
| Module-wise count rates for Quadrant A Data is divided into 100 sec bins |
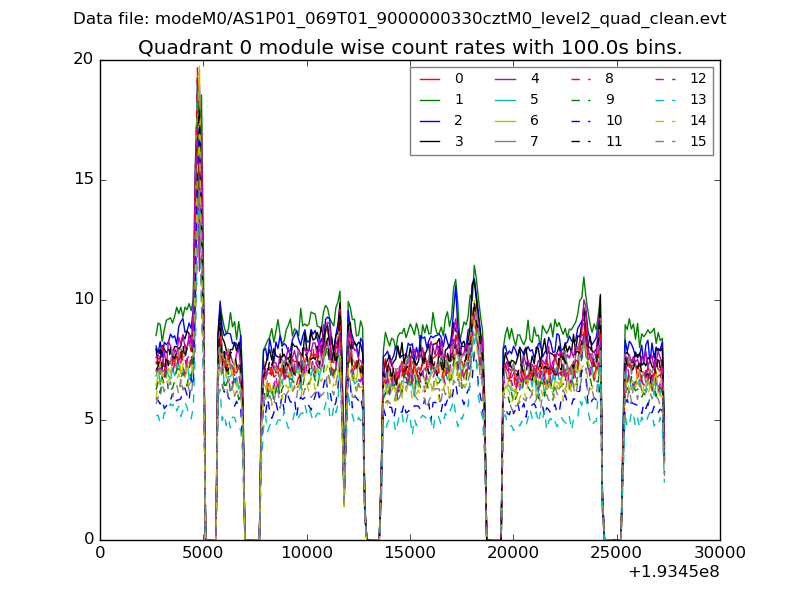 |
 |
| Module-wise count rates for Quadrant B Data is divided into 100 sec bins |
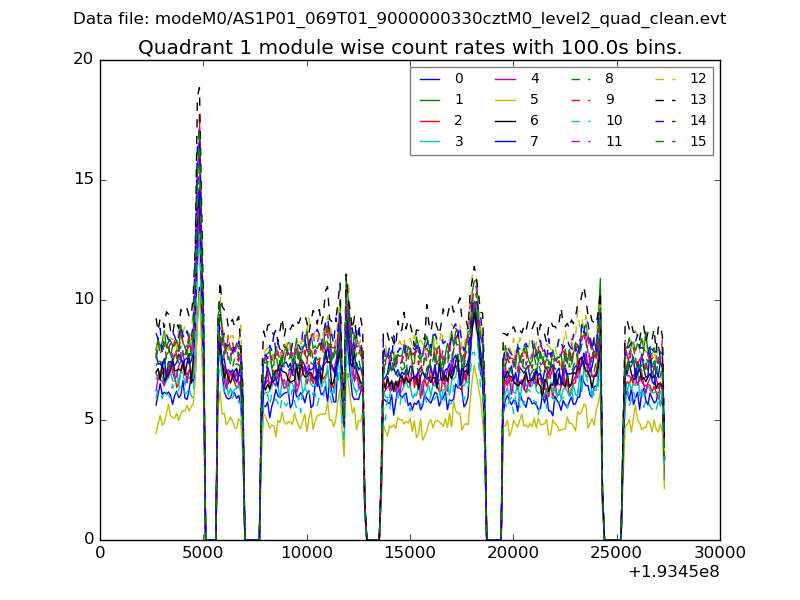 |
 |
| Module-wise count rates for Quadrant C Data is divided into 100 sec bins |
 |
 |
| Module-wise count rates for Quadrant D Data is divided into 100 sec bins |
 |
 |
| Parameter | Plot |
|---|---|
| CZT HV Monitor |  |
| D_VDD | 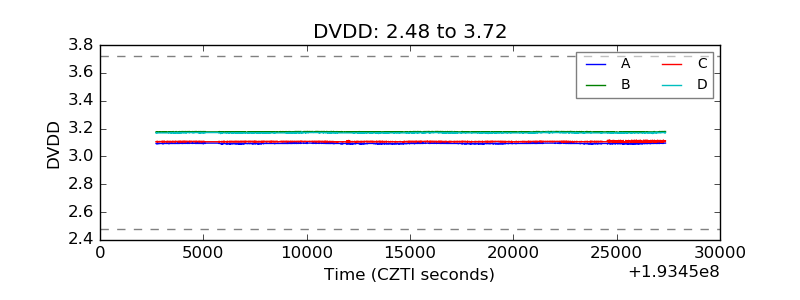 |
| Temperature 1 |  |
| Veto HV Monitor |  |
| Veto LLD |  |
| Alpha Counter |  |
| _CPM_Rate |  |
| CZT Counter |  |
| +2.5 Volts monitor |  |
| +5 Volts monitor |  |
| _ROLL_ROT |  |
| _Roll_DEC |  |
| _Roll_RA |  |
| Veto Counter |  |