| Param | Original file | Final file |
|---|---|---|
| Filename | modeM0/AS1P01_175T02_9000000326cztM0_level2.evt | modeM0/AS1P01_175T02_9000000326cztM0_level2_quad_clean.evt |
| Size (bytes) | 2,634,520,320 | 672,998,400 |
| Size | 2.5 GB | 641.8 MB |
| Events in quadrant A | 21,205,589 | 4,364,129 |
| Events in quadrant B | 19,108,183 | 4,471,148 |
| Events in quadrant C | 18,320,023 | 4,341,475 |
| Events in quadrant D | 18,213,169 | 4,225,694 |
| Mode SS | |||
|---|---|---|---|
| Quadrant | BADHDUFLAG | Total packets | Discarded packets |
| A | 0 | 870 | 0 |
| B | 0 | 870 | 0 |
| C | 0 | 870 | 0 |
| D | 0 | 870 | 0 |
| Mode M9 | |||
|---|---|---|---|
| Quadrant | BADHDUFLAG | Total packets | Discarded packets |
| A | 0 | 6 | 0 |
| B | 1 | 6 | 0 |
| C | 1 | 6 | 0 |
| D | 1 | 1 | 0 |
| Mode M0 | |||
|---|---|---|---|
| Quadrant | BADHDUFLAG | Total packets | Discarded packets |
| A | 0 | 96952 | 0 |
| B | 0 | 90001 | 0 |
| C | 0 | 89942 | 0 |
| D | 0 | 91085 | 0 |
| Quadrant | Total seconds | Saturated seconds | Saturation percentage |
|---|---|---|---|
| A | 43456 | 1180 | 2.715390% |
| B | 43456 | 522 | 1.201215% |
| C | 43456 | 409 | 0.941182% |
| D | 43454 | 456 | 1.049386% |
Noise dominated data is calculated using 1-second bins in cleaned event files. If a bin has >2000 counts, and if more than 50% of those come from <1% of pixels, then it is considered to be noise-dominated and hence unusable.
| Quadrant | # 1 sec bins | Bins with >0 counts | Bins with >2000 counts | High rate bins dominated by noise | Noise dominated (total time) | Noise dominated (detector-on time) | Marked lightcurve |
|---|---|---|---|---|---|---|---|
| A | 49366 | 43464 | 740 | 740 | 1.50% | 1.70% |  |
| B | 49366 | 43464 | 24 | 24 | 0.05% | 0.06% |  |
| C | 49366 | 43464 | 36 | 36 | 0.07% | 0.08% |  |
| D | 49366 | 43463 | 113 | 113 | 0.23% | 0.26% |  |
Top three noisy pixels from each quadrant. If the there are fewer than three noisy pixels in the level2.evt file, extra rows are filled as -1
| Pixel properties | Quadrant properties | ||||||
|---|---|---|---|---|---|---|---|
| Quadrant | DetID | PixID | Counts | Sigma | Mean | Median | Sigma |
| A | 0 | 199 | 3151549 | 3526.91 | 4601 | 4527 | 892.3 |
| A | 15 | 236 | 251698 | 277.01 | 4601 | 4527 | 892.3 |
| A | 0 | 128 | 87631 | 93.14 | 4601 | 4527 | 892.3 |
| B | 0 | 198 | 271650 | 314.97 | 4770 | 4672 | 847.6 |
| B | 5 | 68 | 189621 | 218.19 | 4770 | 4672 | 847.6 |
| B | 15 | 85 | 104652 | 117.95 | 4770 | 4672 | 847.6 |
| C | 10 | 82 | 476103 | 483.3 | 4513 | 4536 | 975.7 |
| C | 10 | 65 | 53701 | 50.39 | 4513 | 4536 | 975.7 |
| C | 5 | 234 | 36576 | 32.84 | 4513 | 4536 | 975.7 |
| D | 2 | 32 | 481609 | 485.0 | 4435 | 4335 | 984.1 |
| D | 7 | 85 | 227217 | 226.49 | 4435 | 4335 | 984.1 |
| D | 13 | 88 | 150237 | 148.26 | 4435 | 4335 | 984.1 |
Histogram calculated using DETX and DETY for each event in the final _common_clean file
| Quadrant A | 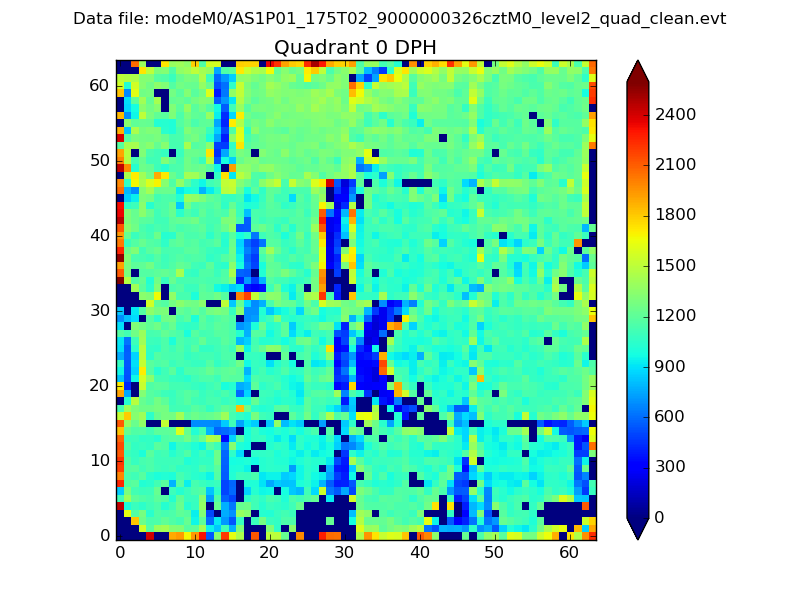 |
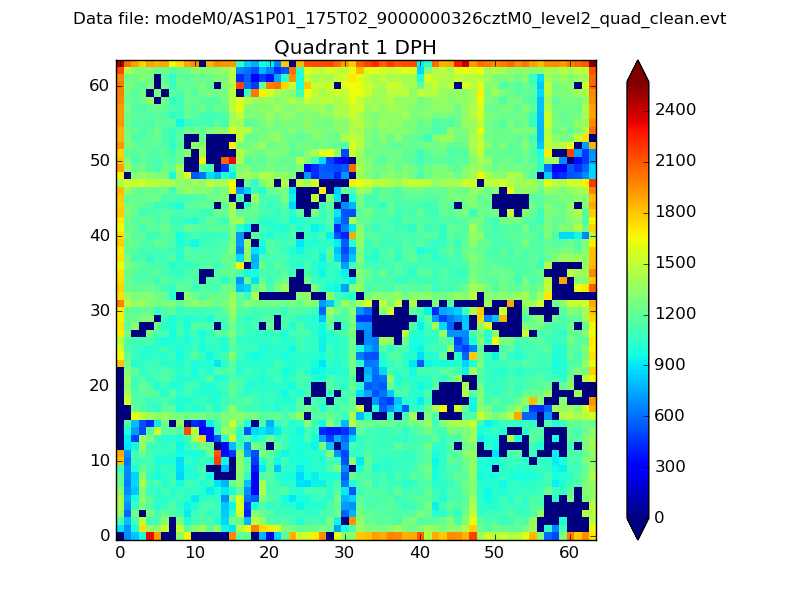 |
Quadrant B |
|---|---|---|---|
| Quadrant D | 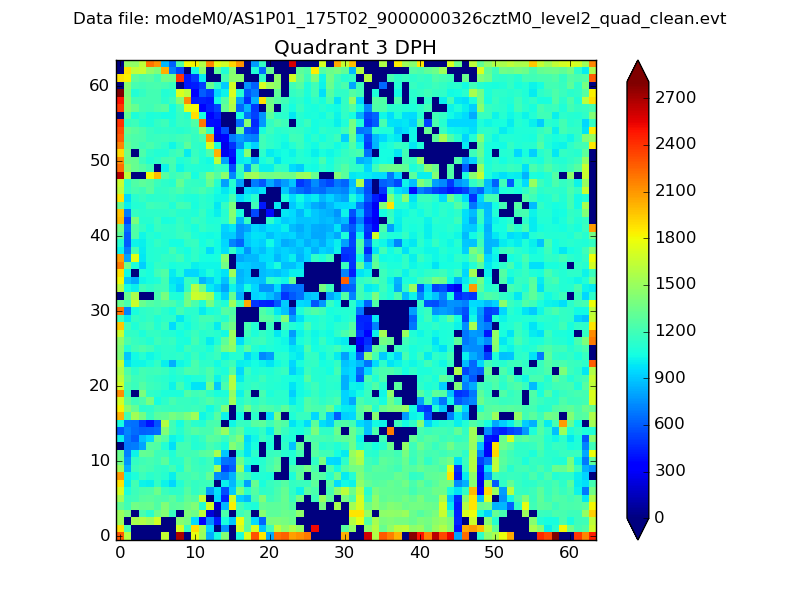 |
 |
Quadrant C |
| Plot type | Count rate plots | Images |
|---|---|---|
| Comparison with Poisson distribution Blue bars denote a histogram of data divided into 1 sec bins. Red curve is a Poisson curve with rate = median count rate of data. |
 |
 |
| Quadrant-wise count rates Data is divided into 100 sec bins |
 |
|
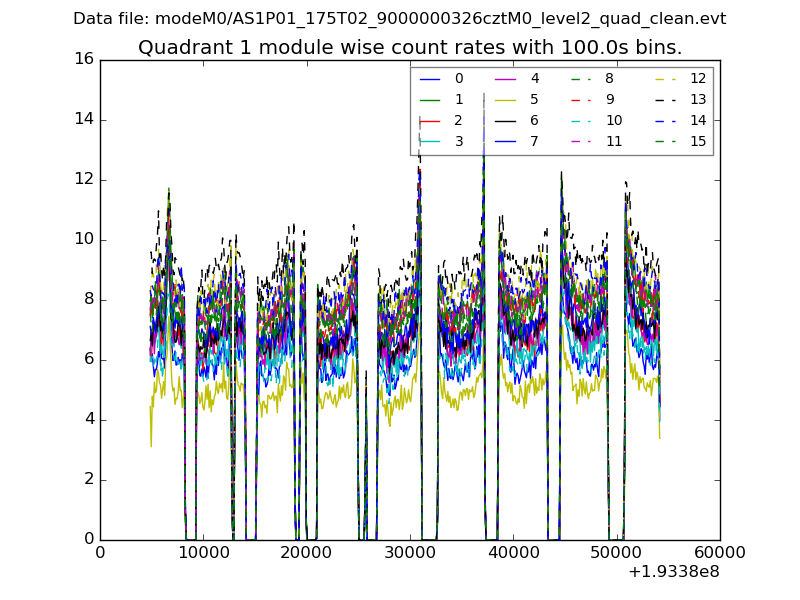
| Module-wise count rates for Quadrant A Data is divided into 100 sec bins |
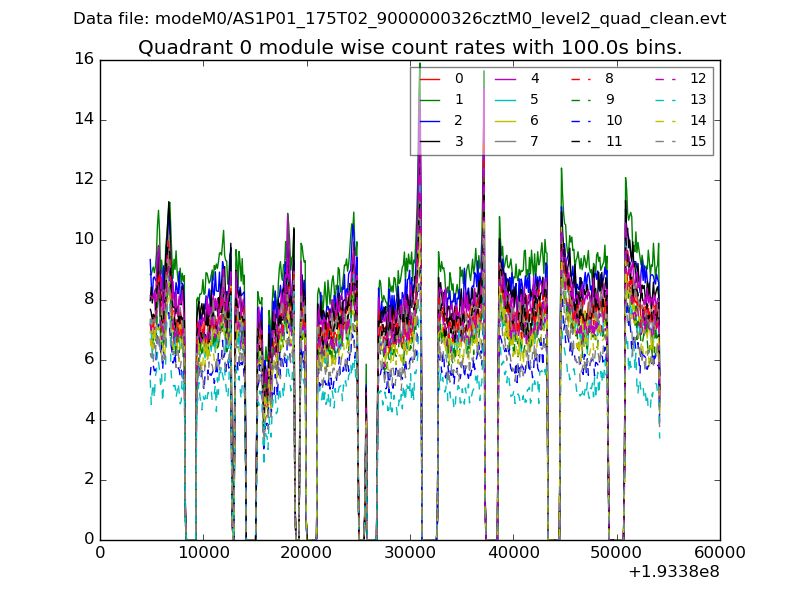 |
 |
| Module-wise count rates for Quadrant B Data is divided into 100 sec bins |
 |
 |
| Module-wise count rates for Quadrant C Data is divided into 100 sec bins |
 |
 |
| Module-wise count rates for Quadrant D Data is divided into 100 sec bins |
 |
 |
| Parameter | Plot |
|---|---|
| CZT HV Monitor |  |
| D_VDD |  |
| Temperature 1 |  |
| Veto HV Monitor |  |
| Veto LLD | 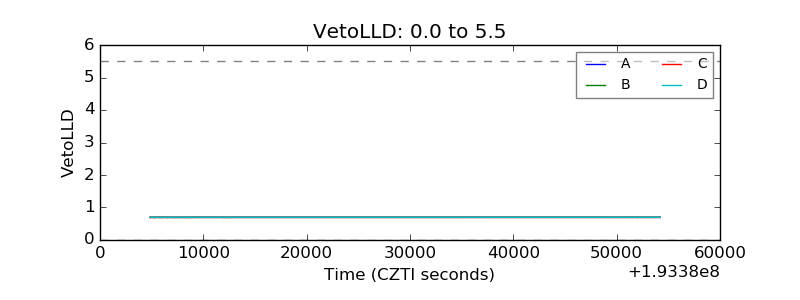 |
| Alpha Counter |  |
| _CPM_Rate |  |
| CZT Counter | 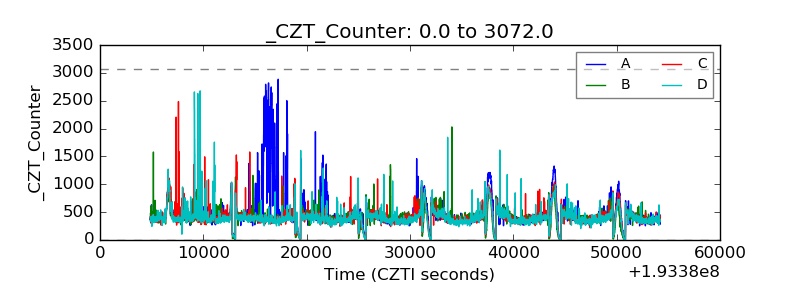 |
| +2.5 Volts monitor |  |
| +5 Volts monitor | 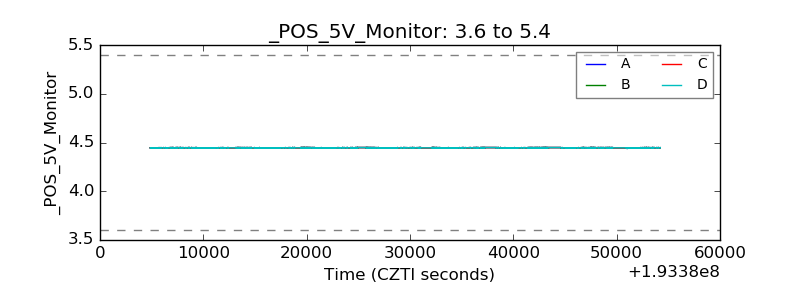 |
| _ROLL_ROT |  |
| _Roll_DEC |  |
| _Roll_RA | 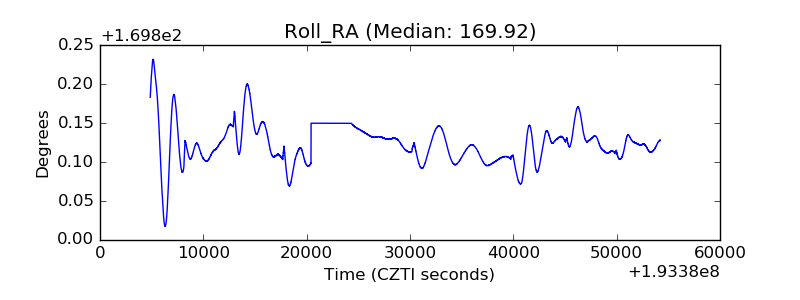 |
| Veto Counter |  |