| Param | Original file | Final file |
|---|---|---|
| Filename | modeM0/AS1P01_163T03_9000000324cztM0_level2.evt | modeM0/AS1P01_163T03_9000000324cztM0_level2_quad_clean.evt |
| Size (bytes) | 4,304,373,120 | 348,474,240 |
| Size | 4.0 GB | 332.3 MB |
| Events in quadrant A | 35,004,550 | 2,188,214 |
| Events in quadrant B | 33,512,855 | 2,242,003 |
| Events in quadrant C | 31,101,710 | 2,198,705 |
| Events in quadrant D | 29,025,031 | 2,135,238 |
| Mode M0 | |||
|---|---|---|---|
| Quadrant | BADHDUFLAG | Total packets | Discarded packets |
| A | 0 | 122477 | 0 |
| B | 0 | 117947 | 0 |
| C | 0 | 110906 | 0 |
| D | 0 | 104774 | 0 |
| Mode SS | |||
|---|---|---|---|
| Quadrant | BADHDUFLAG | Total packets | Discarded packets |
| A | 0 | 530 | 0 |
| B | 0 | 530 | 0 |
| C | 0 | 530 | 0 |
| D | 0 | 530 | 0 |
| Mode M9 | |||
|---|---|---|---|
| Quadrant | BADHDUFLAG | Total packets | Discarded packets |
| A | 0 | 39 | 0 |
| B | 0 | 37 | 0 |
| C | 0 | 37 | 0 |
| D | 0 | 37 | 0 |
| Quadrant | Total seconds | Saturated seconds | Saturation percentage |
|---|---|---|---|
| A | 25982 | 856 | 3.294589% |
| B | 26029 | 148 | 0.568597% |
| C | 26052 | 111 | 0.426071% |
| D | 26085 | 122 | 0.467702% |
Noise dominated data is calculated using 1-second bins in cleaned event files. If a bin has >2000 counts, and if more than 50% of those come from <1% of pixels, then it is considered to be noise-dominated and hence unusable.
| Quadrant | # 1 sec bins | Bins with >0 counts | Bins with >2000 counts | High rate bins dominated by noise | Noise dominated (total time) | Noise dominated (detector-on time) | Marked lightcurve |
|---|---|---|---|---|---|---|---|
| A | 29697 | 25986 | 2939 | 2939 | 9.90% | 11.31% |  |
| B | 29745 | 26034 | 1416 | 1416 | 4.76% | 5.44% |  |
| C | 29767 | 26056 | 1047 | 1047 | 3.52% | 4.02% | 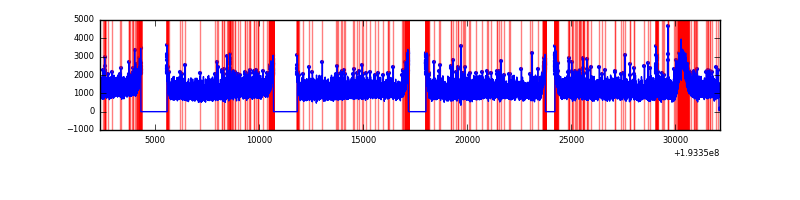 |
| D | 29800 | 26089 | 919 | 919 | 3.08% | 3.52% |  |
Top three noisy pixels from each quadrant. If the there are fewer than three noisy pixels in the level2.evt file, extra rows are filled as -1
| Pixel properties | Quadrant properties | ||||||
|---|---|---|---|---|---|---|---|
| Quadrant | DetID | PixID | Counts | Sigma | Mean | Median | Sigma |
| A | 0 | 128 | 3417227 | 1720.86 | 8209 | 8241 | 1981.0 |
| A | 0 | 199 | 186881 | 90.18 | 8209 | 8241 | 1981.0 |
| A | 10 | 2 | 33575 | 12.79 | 8209 | 8241 | 1981.0 |
| B | 4 | 48 | 456649 | 222.36 | 8619 | 8664 | 2014.7 |
| B | 5 | 68 | 178034 | 84.07 | 8619 | 8664 | 2014.7 |
| B | 0 | 220 | 68619 | 29.76 | 8619 | 8664 | 2014.7 |
| C | 14 | 48 | 121456 | 51.65 | 7893 | 8167 | 2193.3 |
| C | 14 | 223 | 93840 | 39.06 | 7893 | 8167 | 2193.3 |
| C | 10 | 82 | 60576 | 23.89 | 7893 | 8167 | 2193.3 |
| D | 13 | 53 | 184890 | 74.43 | 7646 | 7923 | 2377.7 |
| D | 2 | 32 | 80319 | 30.45 | 7646 | 7923 | 2377.7 |
| D | 7 | 85 | 71497 | 26.74 | 7646 | 7923 | 2377.7 |
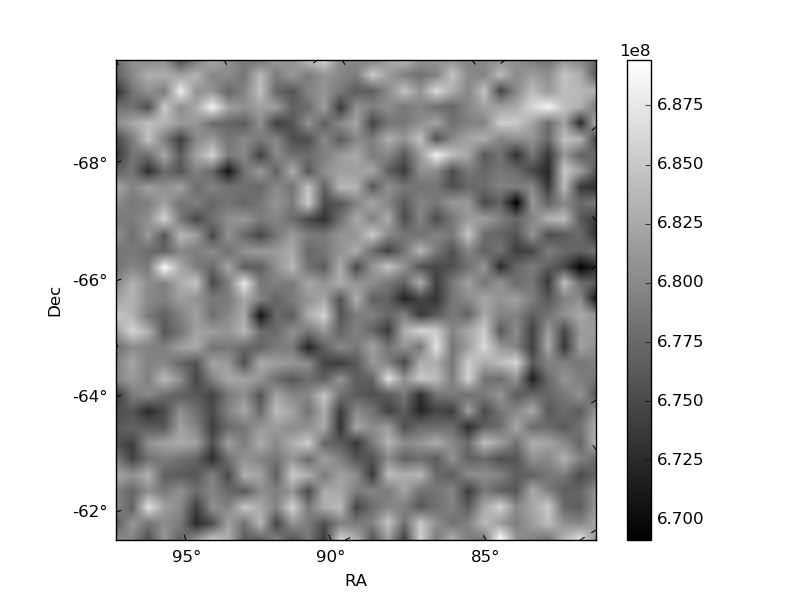
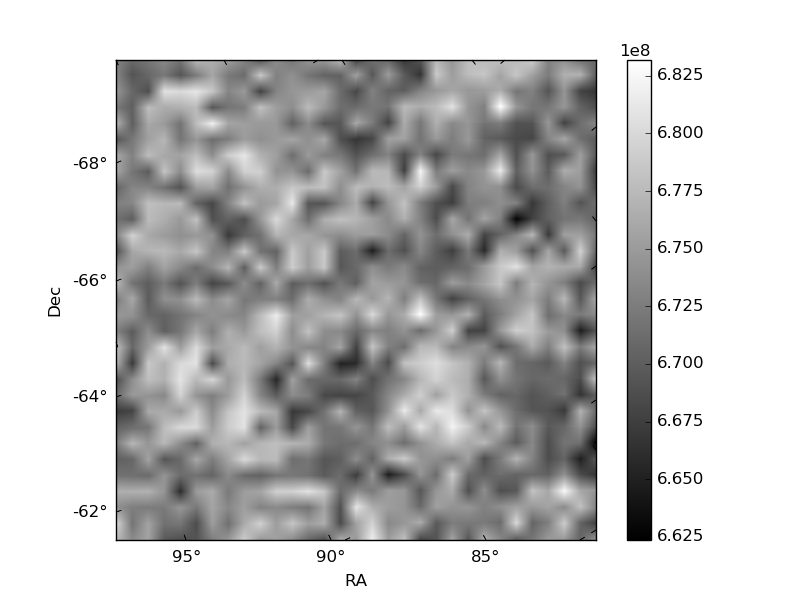
Histogram calculated using DETX and DETY for each event in the final _common_clean file
| Quadrant A | 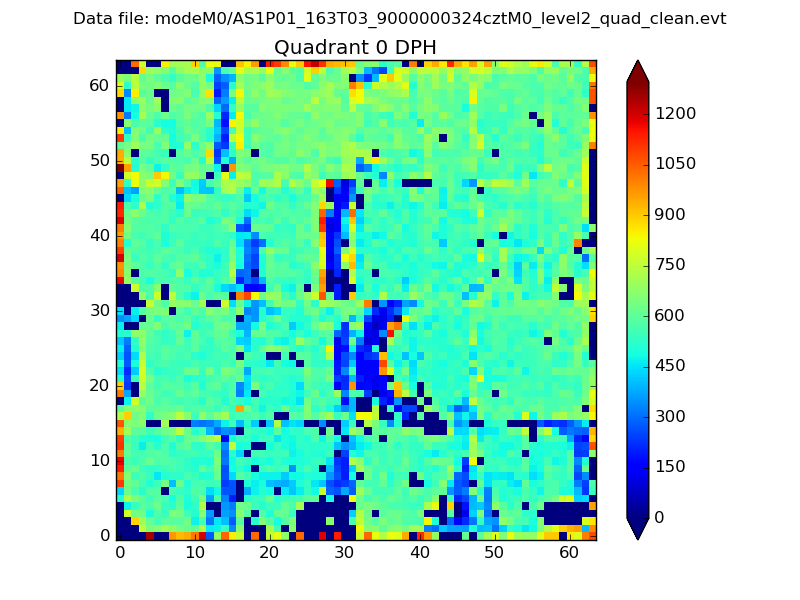 |
 |
Quadrant B |
|---|---|---|---|
| Quadrant D |  |
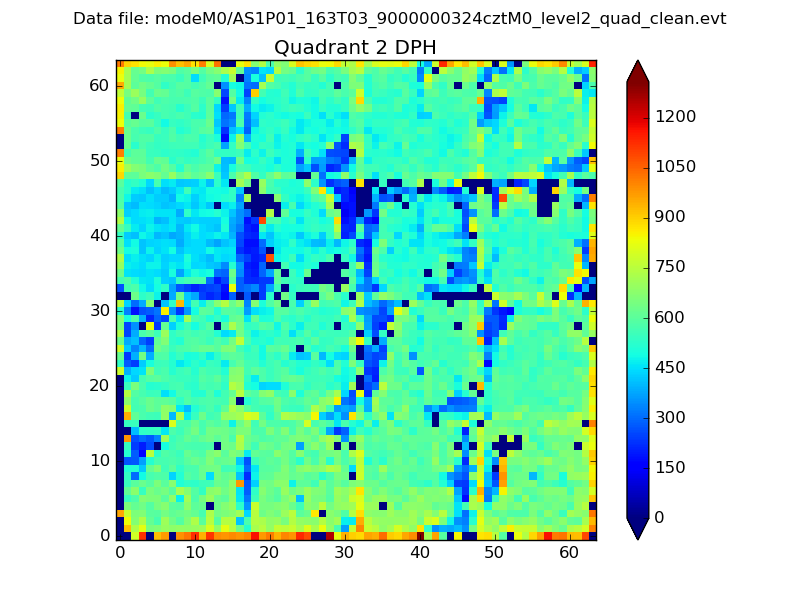 |
Quadrant C |
| Plot type | Count rate plots | Images |
|---|---|---|
| Comparison with Poisson distribution Blue bars denote a histogram of data divided into 1 sec bins. Red curve is a Poisson curve with rate = median count rate of data. |
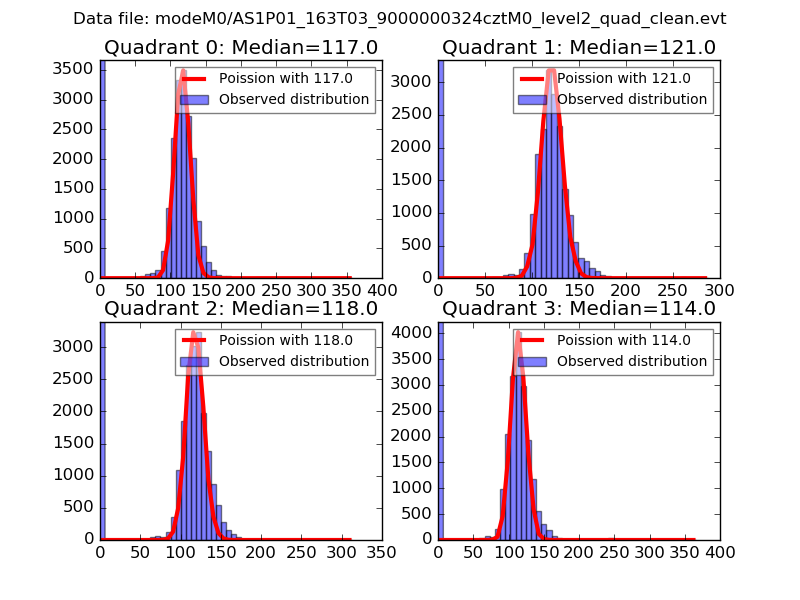 |
 |
| Quadrant-wise count rates Data is divided into 100 sec bins |
 |
|
| Module-wise count rates for Quadrant A Data is divided into 100 sec bins |
 |
 |
| Module-wise count rates for Quadrant B Data is divided into 100 sec bins |
 |
 |
| Module-wise count rates for Quadrant C Data is divided into 100 sec bins |
 |
 |
| Module-wise count rates for Quadrant D Data is divided into 100 sec bins |
 |
 |
| Parameter | Plot |
|---|---|
| CZT HV Monitor |  |
| D_VDD | 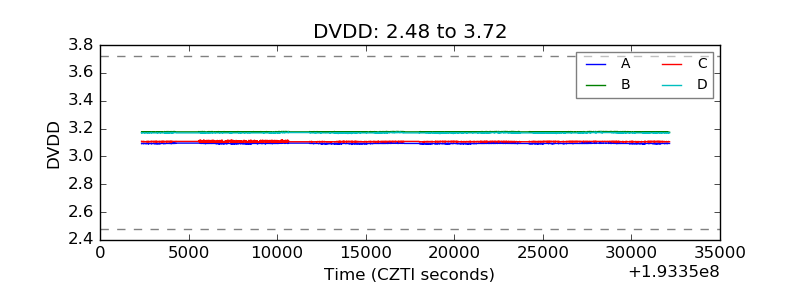 |
| Temperature 1 |  |
| Veto HV Monitor |  |
| Veto LLD |  |
| Alpha Counter |  |
| _CPM_Rate |  |
| CZT Counter |  |
| +2.5 Volts monitor | 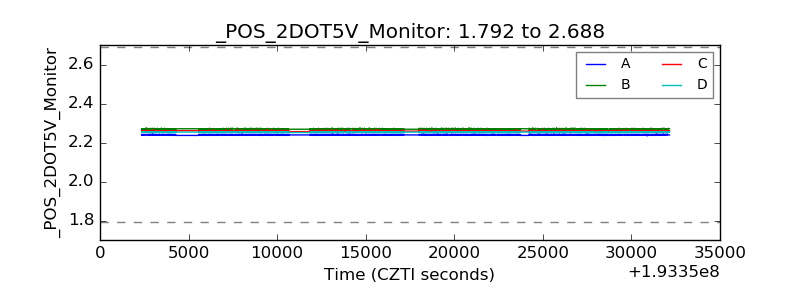 |
| +5 Volts monitor |  |
| _ROLL_ROT | 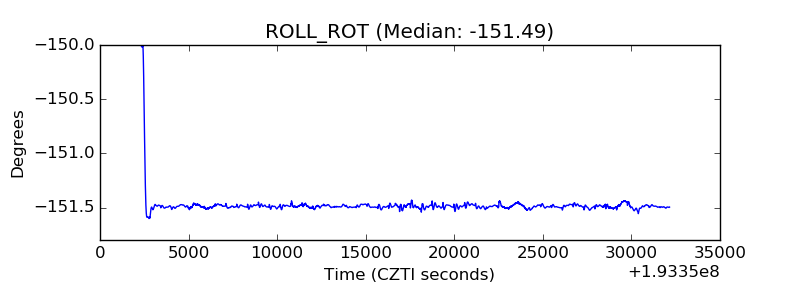 |
| _Roll_DEC | 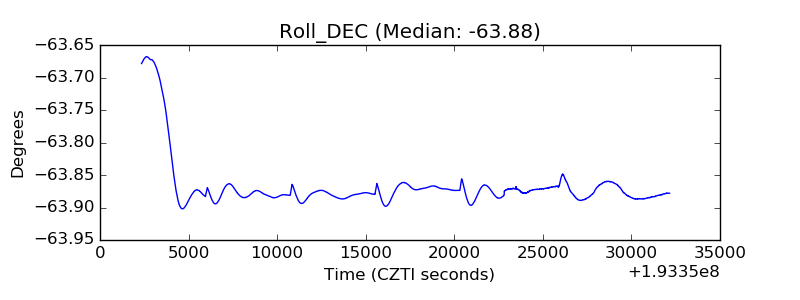 |
| _Roll_RA |  |
| Veto Counter |  |