| Param | Original file | Final file |
|---|---|---|
| Filename | modeM0/AS1P01_175T03_9000000322cztM0_level2.evt | modeM0/AS1P01_175T03_9000000322cztM0_level2_quad_clean.evt |
| Size (bytes) | 13,098,392,640 | 1,024,214,400 |
| Size | 12.2 GB | 976.8 MB |
| Events in quadrant A | 101,038,183 | 6,406,204 |
| Events in quadrant B | 107,592,526 | 6,588,149 |
| Events in quadrant C | 90,491,053 | 6,454,750 |
| Events in quadrant D | 92,402,017 | 6,216,577 |
| Mode M9 | |||
|---|---|---|---|
| Quadrant | BADHDUFLAG | Total packets | Discarded packets |
| A | 0 | 71 | 0 |
| B | 1 | 71 | 0 |
| C | 1 | 71 | 0 |
| D | 1 | 1 | 0 |
| Mode M0 | |||
|---|---|---|---|
| Quadrant | BADHDUFLAG | Total packets | Discarded packets |
| A | 0 | 354997 | 0 |
| B | 0 | 373940 | 0 |
| C | 0 | 323313 | 0 |
| D | 0 | 329183 | 0 |
| Mode SS | |||
|---|---|---|---|
| Quadrant | BADHDUFLAG | Total packets | Discarded packets |
| A | 0 | 1838 | 0 |
| B | 0 | 1838 | 0 |
| C | 0 | 1838 | 0 |
| D | 0 | 1838 | 0 |
| Quadrant | Total seconds | Saturated seconds | Saturation percentage |
|---|---|---|---|
| A | 76601 | 3276 | 4.276707% |
| B | 76600 | 2271 | 2.964752% |
| C | 76602 | 506 | 0.660557% |
| D | 76598 | 1964 | 2.564036% |
Noise dominated data is calculated using 1-second bins in cleaned event files. If a bin has >2000 counts, and if more than 50% of those come from <1% of pixels, then it is considered to be noise-dominated and hence unusable.
| Quadrant | # 1 sec bins | Bins with >0 counts | Bins with >2000 counts | High rate bins dominated by noise | Noise dominated (total time) | Noise dominated (detector-on time) | Marked lightcurve |
|---|---|---|---|---|---|---|---|
| A | 139047 | 105308 | 4481 | 4481 | 3.22% | 4.26% |  |
| B | 139047 | 105589 | 4100 | 4100 | 2.95% | 3.88% |  |
| C | 139047 | 106164 | 1688 | 1688 | 1.21% | 1.59% | 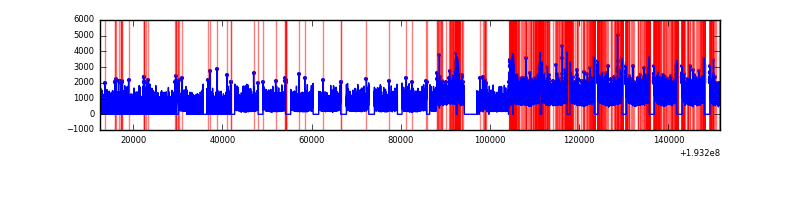 |
| D | 139047 | 106078 | 3722 | 3722 | 2.68% | 3.51% |  |
Top three noisy pixels from each quadrant. If the there are fewer than three noisy pixels in the level2.evt file, extra rows are filled as -1
| Pixel properties | Quadrant properties | ||||||
|---|---|---|---|---|---|---|---|
| Quadrant | DetID | PixID | Counts | Sigma | Mean | Median | Sigma |
| A | 0 | 199 | 9273799 | 1626.16 | 23731 | 23857 | 5688.2 |
| A | 0 | 128 | 847262 | 144.76 | 23731 | 23857 | 5688.2 |
| A | 15 | 171 | 113595 | 15.78 | 23731 | 23857 | 5688.2 |
| B | 4 | 48 | 7787964 | 1326.29 | 24981 | 25058 | 5853.1 |
| B | 5 | 68 | 3072642 | 520.68 | 24981 | 25058 | 5853.1 |
| B | 8 | 3 | 1636951 | 275.39 | 24981 | 25058 | 5853.1 |
| C | 14 | 223 | 248290 | 35.04 | 23015 | 23802 | 6405.7 |
| C | 10 | 82 | 195004 | 26.73 | 23015 | 23802 | 6405.7 |
| C | 10 | 34 | 161248 | 21.46 | 23015 | 23802 | 6405.7 |
| D | 2 | 32 | 3156712 | 458.37 | 22091 | 22908 | 6836.8 |
| D | 13 | 232 | 1940737 | 280.52 | 22091 | 22908 | 6836.8 |
| D | 1 | 84 | 1505281 | 216.82 | 22091 | 22908 | 6836.8 |
Histogram calculated using DETX and DETY for each event in the final _common_clean file
| Quadrant A |  |
 |
Quadrant B |
|---|---|---|---|
| Quadrant D |  |
 |
Quadrant C |
| Plot type | Count rate plots | Images |
|---|---|---|
| Comparison with Poisson distribution Blue bars denote a histogram of data divided into 1 sec bins. Red curve is a Poisson curve with rate = median count rate of data. |
 |
 |
| Quadrant-wise count rates Data is divided into 100 sec bins |
 |
|
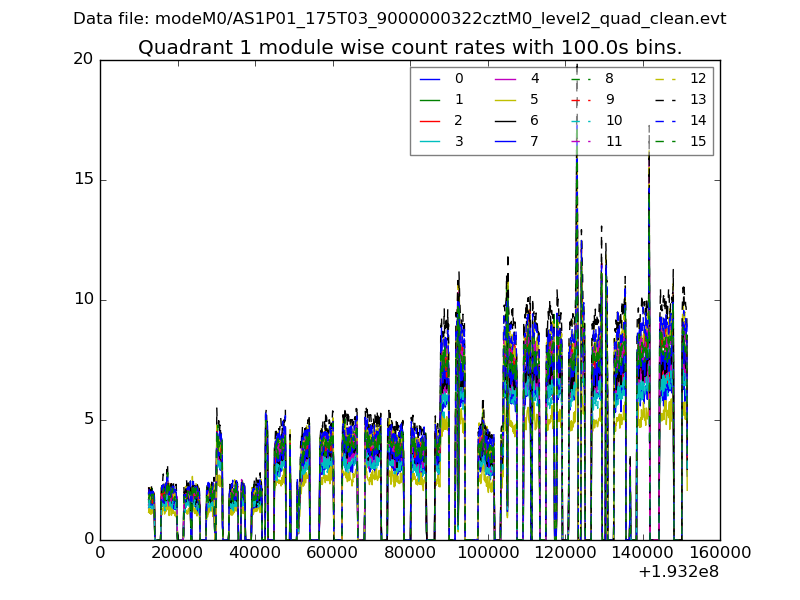
| Module-wise count rates for Quadrant A Data is divided into 100 sec bins |
 |
 |
| Module-wise count rates for Quadrant B Data is divided into 100 sec bins |
 |
 |
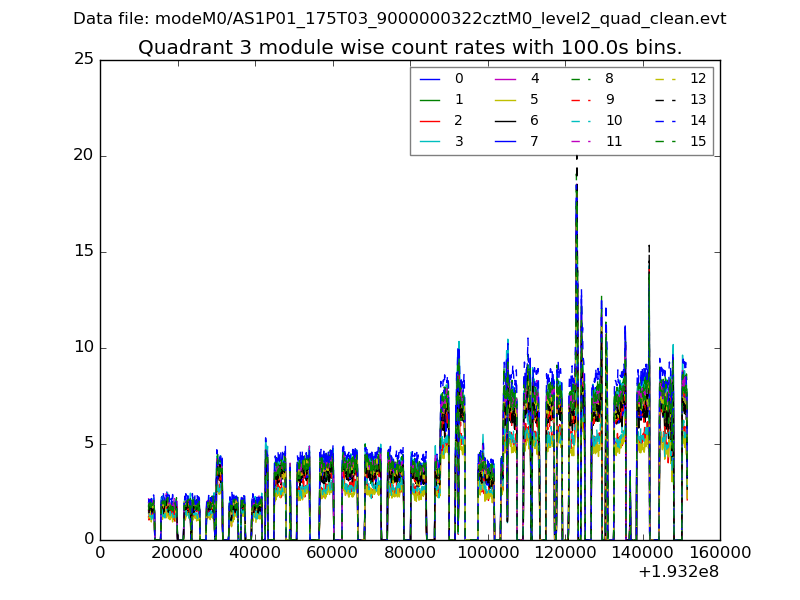
| Module-wise count rates for Quadrant C Data is divided into 100 sec bins |
 |
 |
| Module-wise count rates for Quadrant D Data is divided into 100 sec bins |
 |
 |
| Parameter | Plot |
|---|---|
| CZT HV Monitor |  |
| D_VDD |  |
| Temperature 1 | 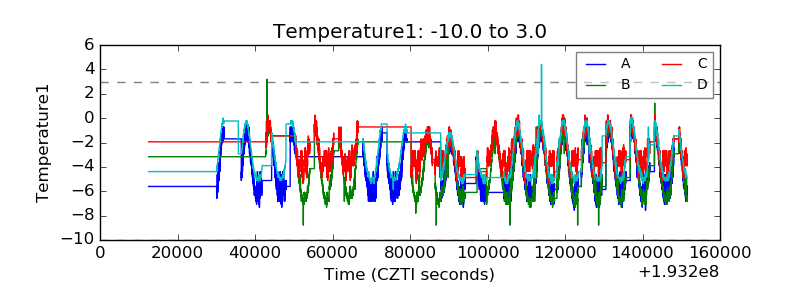 |
| Veto HV Monitor |  |
| Veto LLD |  |
| Alpha Counter |  |
| _CPM_Rate |  |
| CZT Counter |  |
| +2.5 Volts monitor |  |
| +5 Volts monitor |  |
| _ROLL_ROT |  |
| _Roll_DEC |  |
| _Roll_RA |  |
| Veto Counter |  |