| Param | Original file | Final file |
|---|---|---|
| Filename | modeM0/AS1P01_161T03_9000000320cztM0_level2.evt | modeM0/AS1P01_161T03_9000000320cztM0_level2_quad_clean.evt |
| Size (bytes) | 2,888,023,680 | 246,024,000 |
| Size | 2.7 GB | 234.6 MB |
| Events in quadrant A | 22,718,811 | 1,535,884 |
| Events in quadrant B | 22,982,814 | 1,580,101 |
| Events in quadrant C | 20,955,678 | 1,572,911 |
| Events in quadrant D | 19,586,067 | 1,501,992 |
| Mode M0 | |||
|---|---|---|---|
| Quadrant | BADHDUFLAG | Total packets | Discarded packets |
| A | 0 | 80175 | 0 |
| B | 0 | 80891 | 0 |
| C | 0 | 74926 | 0 |
| D | 0 | 70977 | 0 |
| Mode M9 | |||
|---|---|---|---|
| Quadrant | BADHDUFLAG | Total packets | Discarded packets |
| A | 0 | 1 | 0 |
| B | 1 | 1 | 0 |
| C | 1 | 1 | 0 |
| D | 1 | 1 | 0 |
| Mode SS | |||
|---|---|---|---|
| Quadrant | BADHDUFLAG | Total packets | Discarded packets |
| A | 0 | 434 | 0 |
| B | 0 | 434 | 0 |
| C | 0 | 436 | 0 |
| D | 0 | 434 | 0 |
| Quadrant | Total seconds | Saturated seconds | Saturation percentage |
|---|---|---|---|
| A | 17786 | 146 | 0.820870% |
| B | 17796 | 74 | 0.415824% |
| C | 17805 | 71 | 0.398764% |
| D | 17799 | 59 | 0.331479% |
Noise dominated data is calculated using 1-second bins in cleaned event files. If a bin has >2000 counts, and if more than 50% of those come from <1% of pixels, then it is considered to be noise-dominated and hence unusable.
| Quadrant | # 1 sec bins | Bins with >0 counts | Bins with >2000 counts | High rate bins dominated by noise | Noise dominated (total time) | Noise dominated (detector-on time) | Marked lightcurve |
|---|---|---|---|---|---|---|---|
| A | 42367 | 30442 | 633 | 633 | 1.49% | 2.08% |  |
| B | 42367 | 30461 | 450 | 450 | 1.06% | 1.48% | 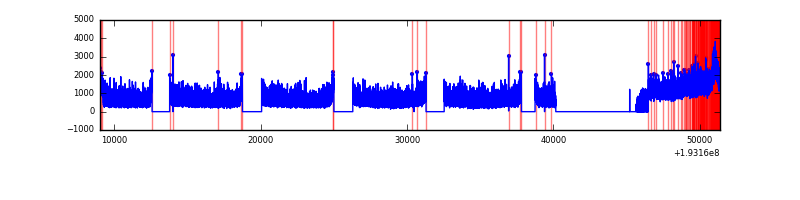 |
| C | 42367 | 30481 | 358 | 358 | 0.84% | 1.17% |  |
| D | 42367 | 30466 | 262 | 262 | 0.62% | 0.86% | 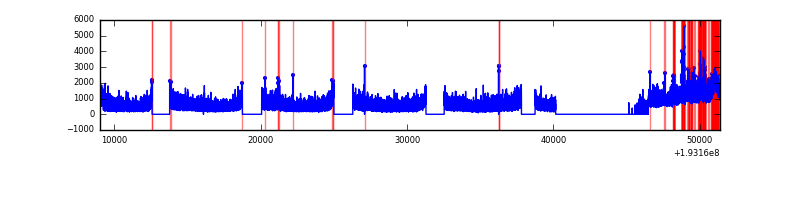 |
Top three noisy pixels from each quadrant. If the there are fewer than three noisy pixels in the level2.evt file, extra rows are filled as -1
| Pixel properties | Quadrant properties | ||||||
|---|---|---|---|---|---|---|---|
| Quadrant | DetID | PixID | Counts | Sigma | Mean | Median | Sigma |
| A | 0 | 199 | 927067 | 687.25 | 5607 | 5666 | 1340.7 |
| A | 0 | 128 | 263613 | 192.4 | 5607 | 5666 | 1340.7 |
| A | 14 | 5 | 59325 | 40.02 | 5607 | 5666 | 1340.7 |
| B | 5 | 68 | 374667 | 271.28 | 5864 | 5915 | 1359.3 |
| B | 4 | 48 | 233788 | 167.64 | 5864 | 5915 | 1359.3 |
| B | 0 | 198 | 69176 | 46.54 | 5864 | 5915 | 1359.3 |
| C | 10 | 65 | 68580 | 42.52 | 5335 | 5528 | 1482.8 |
| C | 10 | 82 | 47675 | 28.42 | 5335 | 5528 | 1482.8 |
| C | 14 | 223 | 36217 | 20.7 | 5335 | 5528 | 1482.8 |
| D | 2 | 32 | 136966 | 82.71 | 5134 | 5325 | 1591.6 |
| D | 13 | 53 | 77417 | 45.29 | 5134 | 5325 | 1591.6 |
| D | 12 | 3 | 66789 | 38.62 | 5134 | 5325 | 1591.6 |
Histogram calculated using DETX and DETY for each event in the final _common_clean file
| Quadrant A | 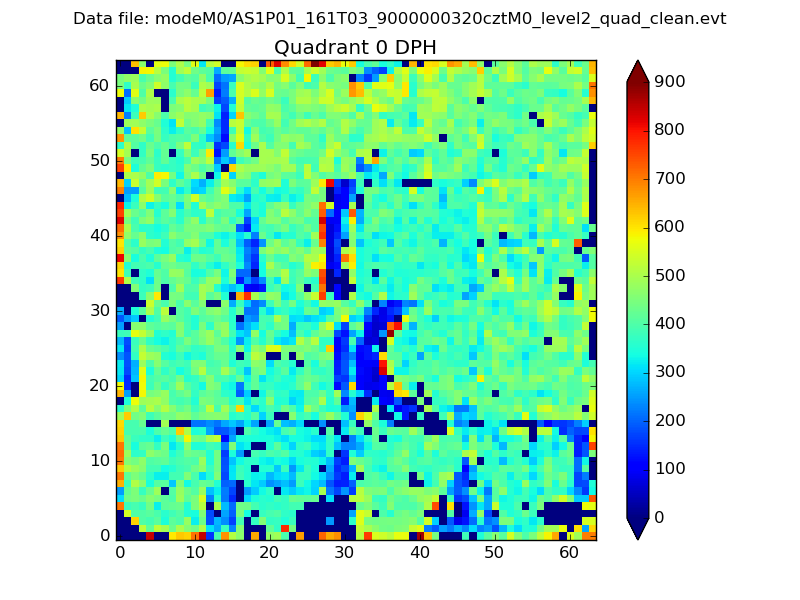 |
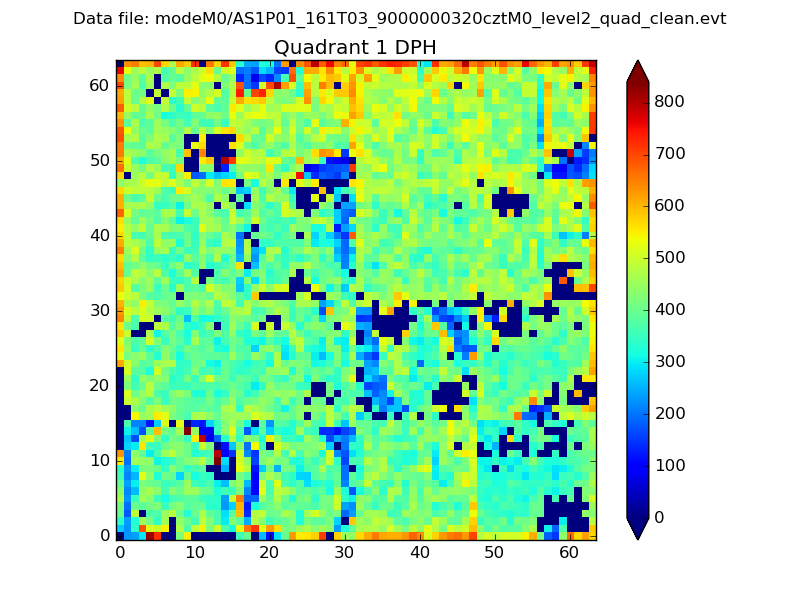 |
Quadrant B |
|---|---|---|---|
| Quadrant D |  |
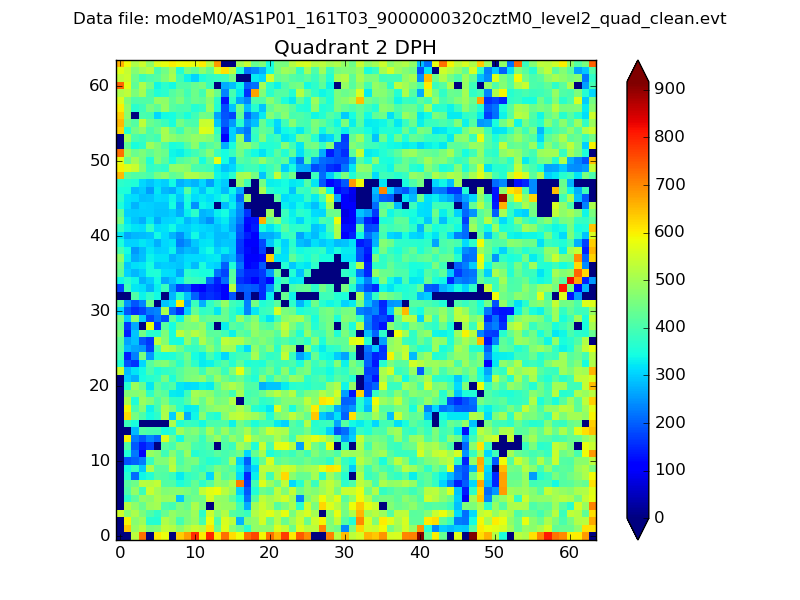 |
Quadrant C |
| Plot type | Count rate plots | Images |
|---|---|---|
| Comparison with Poisson distribution Blue bars denote a histogram of data divided into 1 sec bins. Red curve is a Poisson curve with rate = median count rate of data. |
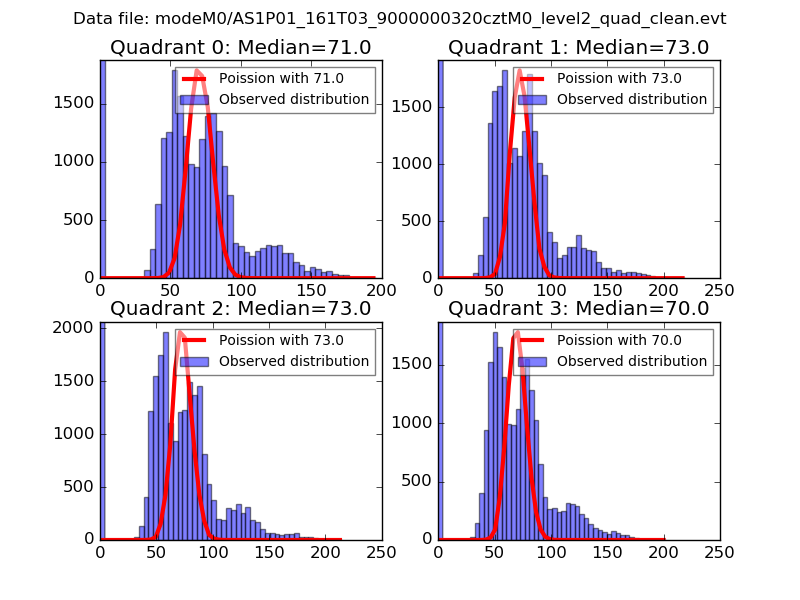 |
 |
| Quadrant-wise count rates Data is divided into 100 sec bins |
 |
|
| Module-wise count rates for Quadrant A Data is divided into 100 sec bins |
 |
 |
| Module-wise count rates for Quadrant B Data is divided into 100 sec bins |
 |
 |
| Module-wise count rates for Quadrant C Data is divided into 100 sec bins |
 |
 |
| Module-wise count rates for Quadrant D Data is divided into 100 sec bins |
 |
 |
| Parameter | Plot |
|---|---|
| CZT HV Monitor | 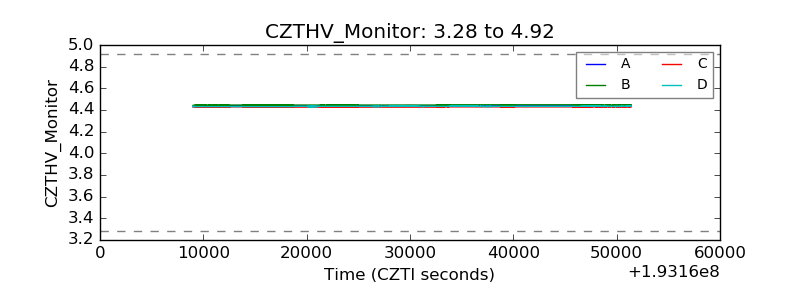 |
| D_VDD |  |
| Temperature 1 |  |
| Veto HV Monitor |  |
| Veto LLD | 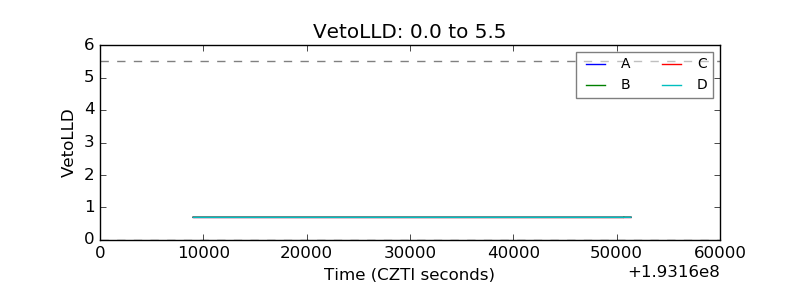 |
| Alpha Counter |  |
| _CPM_Rate |  |
| CZT Counter |  |
| +2.5 Volts monitor |  |
| +5 Volts monitor | 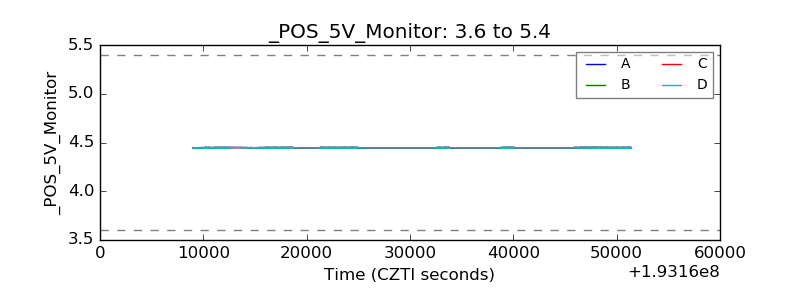 |
| _ROLL_ROT |  |
| _Roll_DEC |  |
| _Roll_RA | 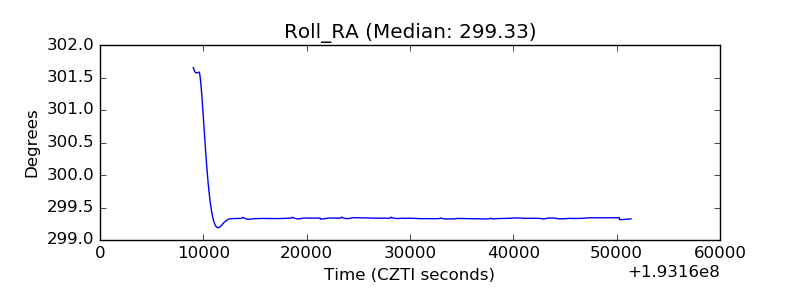 |
| Veto Counter |  |