| Param | Original file | Final file |
|---|---|---|
| Filename | modeM0/AS1T01_052T01_9000000316cztM0_level2.evt | modeM0/AS1T01_052T01_9000000316cztM0_level2_quad_clean.evt |
| Size (bytes) | 20,294,277,120 | 1,142,251,200 |
| Size | 18.9 GB | 1.1 GB |
| Events in quadrant A | 154,947,054 | 6,595,789 |
| Events in quadrant B | 155,101,648 | 6,792,032 |
| Events in quadrant C | 146,003,920 | 6,628,063 |
| Events in quadrant D | 150,476,400 | 6,150,942 |
| Mode M0 | |||
|---|---|---|---|
| Quadrant | BADHDUFLAG | Total packets | Discarded packets |
| A | 0 | 547548 | 0 |
| B | 0 | 547986 | 0 |
| C | 0 | 521140 | 0 |
| D | 0 | 535478 | 0 |
| Mode M9 | |||
|---|---|---|---|
| Quadrant | BADHDUFLAG | Total packets | Discarded packets |
| A | 0 | 19 | 0 |
| B | 1 | 19 | 0 |
| C | 1 | 19 | 0 |
| D | 1 | 1 | 0 |
| Mode SS | |||
|---|---|---|---|
| Quadrant | BADHDUFLAG | Total packets | Discarded packets |
| A | 0 | 2462 | 0 |
| B | 0 | 2462 | 0 |
| C | 0 | 2462 | 0 |
| D | 0 | 2462 | 0 |
| Quadrant | Total seconds | Saturated seconds | Saturation percentage |
|---|---|---|---|
| A | 122987 | 1708 | 1.388765% |
| B | 122981 | 764 | 0.621234% |
| C | 122981 | 441 | 0.358592% |
| D | 122981 | 5292 | 4.303104% |
Noise dominated data is calculated using 1-second bins in cleaned event files. If a bin has >2000 counts, and if more than 50% of those come from <1% of pixels, then it is considered to be noise-dominated and hence unusable.
| Quadrant | # 1 sec bins | Bins with >0 counts | Bins with >2000 counts | High rate bins dominated by noise | Noise dominated (total time) | Noise dominated (detector-on time) | Marked lightcurve |
|---|---|---|---|---|---|---|---|
| A | 143102 | 123008 | 6622 | 6622 | 4.63% | 5.38% |  |
| B | 143102 | 123007 | 5445 | 5445 | 3.80% | 4.43% |  |
| C | 143102 | 123008 | 4575 | 4575 | 3.20% | 3.72% | 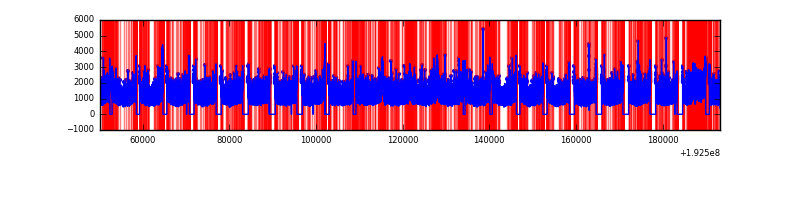 |
| D | 143102 | 123006 | 9931 | 9931 | 6.94% | 8.07% |  |
Top three noisy pixels from each quadrant. If the there are fewer than three noisy pixels in the level2.evt file, extra rows are filled as -1
| Pixel properties | Quadrant properties | ||||||
|---|---|---|---|---|---|---|---|
| Quadrant | DetID | PixID | Counts | Sigma | Mean | Median | Sigma |
| A | 14 | 5 | 3418185 | 362.56 | 38674 | 39025 | 9320.3 |
| A | 12 | 236 | 1580211 | 165.36 | 38674 | 39025 | 9320.3 |
| A | 0 | 231 | 1438449 | 150.15 | 38674 | 39025 | 9320.3 |
| B | 5 | 68 | 299216 | 27.29 | 40622 | 40815 | 9469.9 |
| B | 0 | 220 | 269806 | 24.18 | 40622 | 40815 | 9469.9 |
| B | 15 | 85 | 224262 | 19.37 | 40622 | 40815 | 9469.9 |
| C | 9 | 85 | 1988093 | 190.65 | 36771 | 38086 | 10228.1 |
| C | 9 | 54 | 301928 | 25.8 | 36771 | 38086 | 10228.1 |
| C | 14 | 223 | 203482 | 16.17 | 36771 | 38086 | 10228.1 |
| D | 13 | 169 | 14115038 | 1305.65 | 34861 | 36195 | 10783.0 |
| D | 10 | 166 | 2608088 | 238.51 | 34861 | 36195 | 10783.0 |
| D | 9 | 66 | 1508669 | 136.55 | 34861 | 36195 | 10783.0 |
Histogram calculated using DETX and DETY for each event in the final _common_clean file
| Quadrant A |  |
 |
Quadrant B |
|---|---|---|---|
| Quadrant D |  |
 |
Quadrant C |
| Plot type | Count rate plots | Images |
|---|---|---|
| Comparison with Poisson distribution Blue bars denote a histogram of data divided into 1 sec bins. Red curve is a Poisson curve with rate = median count rate of data. |
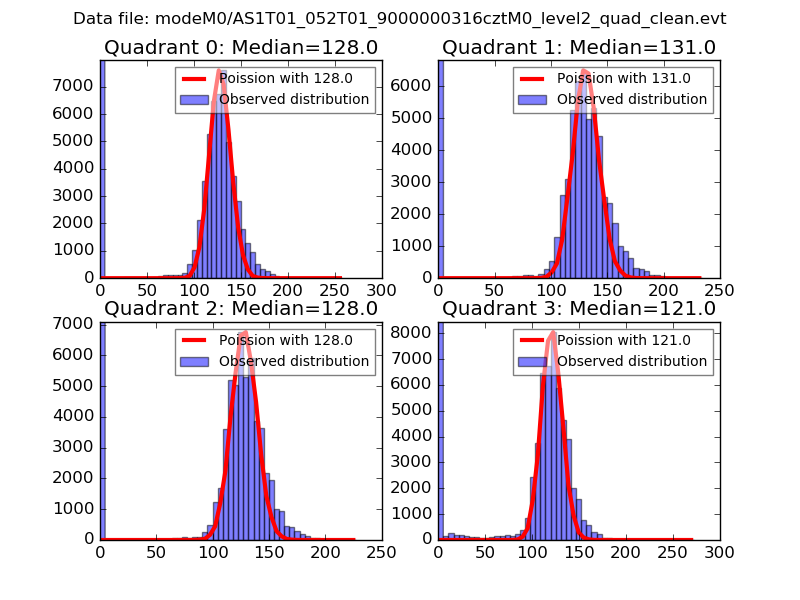 |
 |
| Quadrant-wise count rates Data is divided into 100 sec bins |
 |
|
| Module-wise count rates for Quadrant A Data is divided into 100 sec bins |
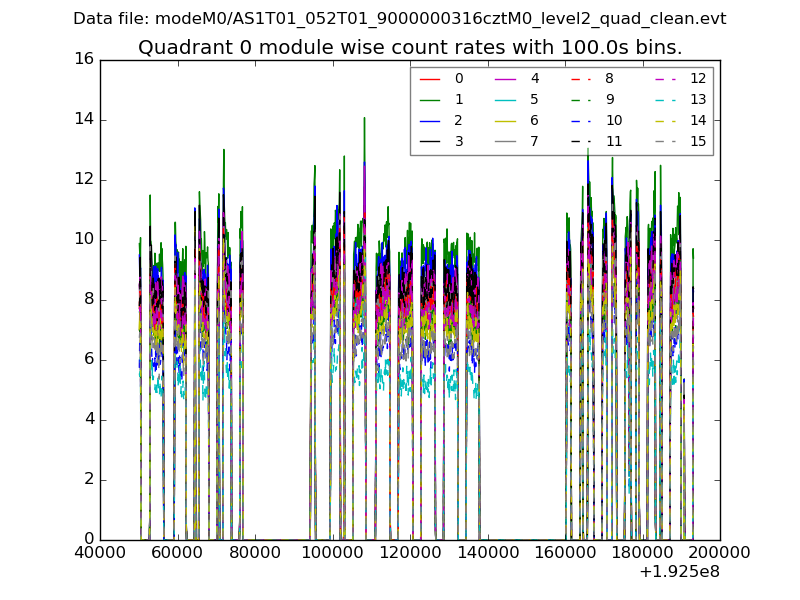 |
 |
| Module-wise count rates for Quadrant B Data is divided into 100 sec bins |
 |
 |
| Module-wise count rates for Quadrant C Data is divided into 100 sec bins |
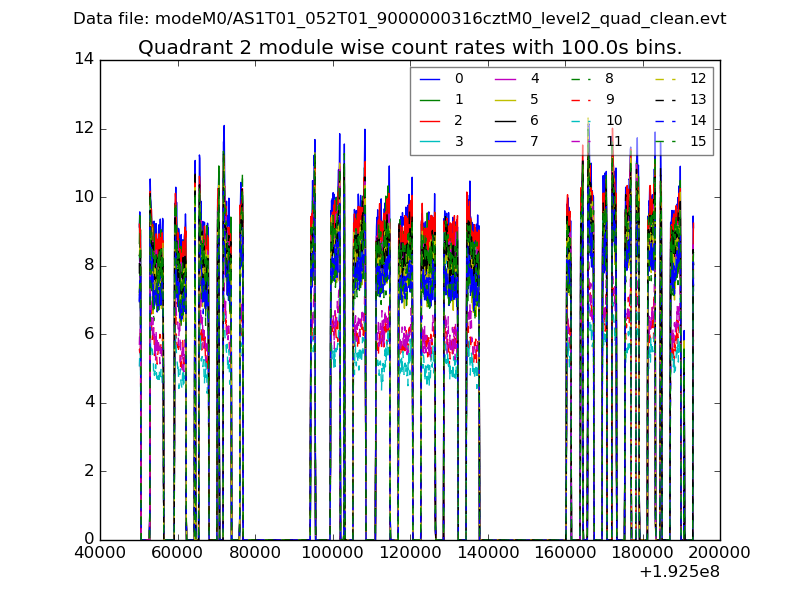 |
 |
| Module-wise count rates for Quadrant D Data is divided into 100 sec bins |
 |
 |
| Parameter | Plot |
|---|---|
| CZT HV Monitor |  |
| D_VDD | 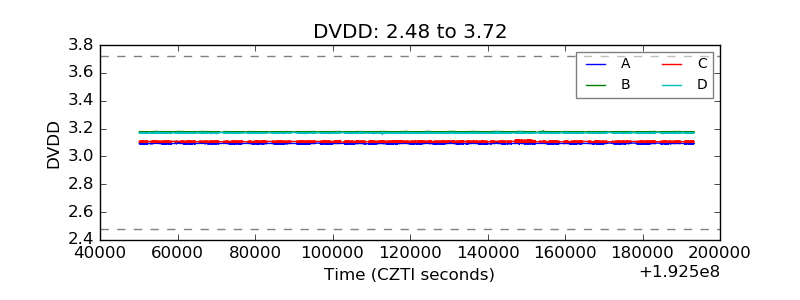 |
| Temperature 1 |  |
| Veto HV Monitor | 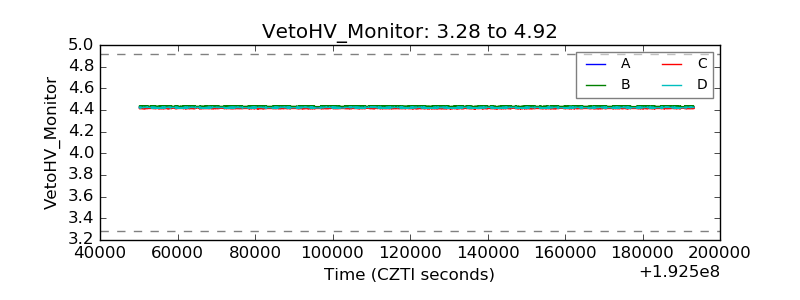 |
| Veto LLD |  |
| Alpha Counter |  |
| _CPM_Rate |  |
| CZT Counter |  |
| +2.5 Volts monitor |  |
| +5 Volts monitor | 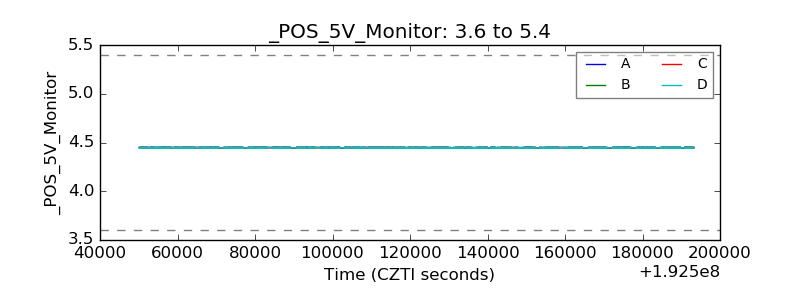 |
| _ROLL_ROT |  |
| _Roll_DEC | 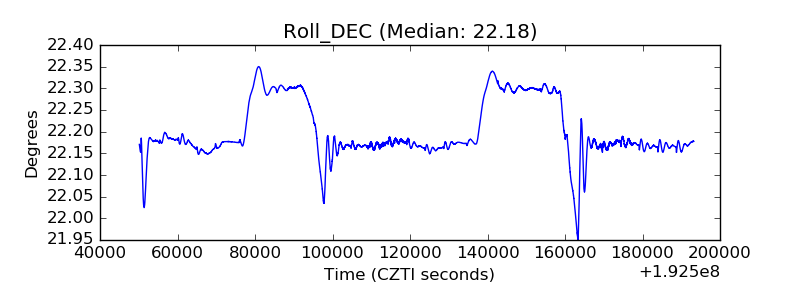 |
| _Roll_RA |  |
| Veto Counter | 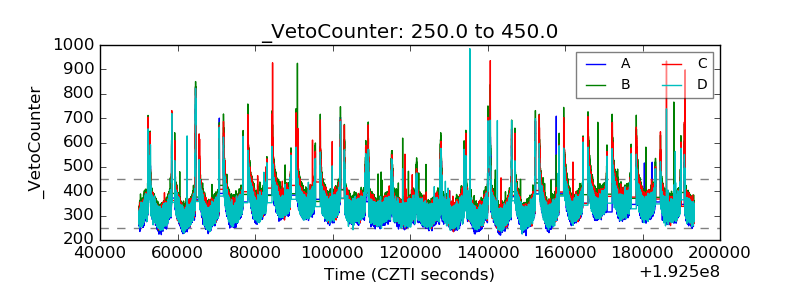 |