| Param | Original file | Final file |
|---|---|---|
| Filename | modeM0/AS1T01_055T01_9000000314cztM0_level2_bc.evt | modeM0/AS1T01_055T01_9000000314cztM0_level2_quad_clean.evt |
| Size (bytes) | 5,794,758,720 | 2,067,851,520 |
| Size | 5.4 GB | 1.9 GB |
| Events in quadrant A | 41,309,394 | 12,227,088 |
| Events in quadrant B | 40,195,654 | 12,231,620 |
| Events in quadrant C | 37,305,603 | 12,087,264 |
| Events in quadrant D | 42,467,403 | 11,800,462 |
| Mode M0 | |||
|---|---|---|---|
| Quadrant | BADHDUFLAG | Total packets | Discarded packets |
| A | 0 | 906817 | 0 |
| B | 0 | 926182 | 0 |
| C | 0 | 866548 | 0 |
| D | 0 | 838164 | 0 |
| Mode SS | |||
|---|---|---|---|
| Quadrant | BADHDUFLAG | Total packets | Discarded packets |
| A | 0 | 4172 | 0 |
| B | 0 | 4172 | 0 |
| C | 0 | 4172 | 0 |
| D | 0 | 4172 | 0 |
| Mode M9 | |||
|---|---|---|---|
| Quadrant | BADHDUFLAG | Total packets | Discarded packets |
| A | 0 | 30 | 0 |
| B | 1 | 30 | 0 |
| C | 1 | 30 | 0 |
| D | 1 | 1 | 0 |
| Quadrant | Total seconds | Saturated seconds | Saturation percentage |
|---|---|---|---|
| A | 208551 | 1296 | 0.621431% |
| B | 208549 | 1827 | 0.876053% |
| C | 208554 | 708 | 0.339480% |
| D | 208562 | 1233 | 0.591191% |
Noise dominated data is calculated using 1-second bins in cleaned event files. If a bin has >2000 counts, and if more than 50% of those come from <1% of pixels, then it is considered to be noise-dominated and hence unusable.
| Quadrant | # 1 sec bins | Bins with >0 counts | Bins with >2000 counts | High rate bins dominated by noise | Noise dominated (total time) | Noise dominated (detector-on time) | Marked lightcurve |
|---|---|---|---|---|---|---|---|
| A | 245767 | 208571 | 15 | 15 | 0.01% | 0.01% |  |
| B | 245767 | 208565 | 70 | 70 | 0.03% | 0.03% |  |
| C | 245767 | 208567 | 10 | 10 | 0.00% | 0.00% |  |
| D | 245767 | 208581 | 350 | 350 | 0.14% | 0.17% |  |
Top three noisy pixels from each quadrant. If the there are fewer than three noisy pixels in the level2.evt file, extra rows are filled as -1
| Pixel properties | Quadrant properties | ||||||
|---|---|---|---|---|---|---|---|
| Quadrant | DetID | PixID | Counts | Sigma | Mean | Median | Sigma |
| A | 0 | 231 | 3493158 | 1787.22 | 9473 | 9250 | 1949.3 |
| A | 15 | 175 | 696522 | 352.57 | 9473 | 9250 | 1949.3 |
| A | 0 | 128 | 271546 | 134.56 | 9473 | 9250 | 1949.3 |
| B | 3 | 0 | 529417 | 307.38 | 9711 | 9398 | 1691.8 |
| B | 3 | 32 | 497290 | 288.39 | 9711 | 9398 | 1691.8 |
| B | 0 | 190 | 252365 | 143.61 | 9711 | 9398 | 1691.8 |
| C | 14 | 223 | 185306 | 92.28 | 9333 | 9151 | 1908.9 |
| C | 10 | 34 | 169627 | 84.07 | 9333 | 9151 | 1908.9 |
| C | 9 | 191 | 115872 | 55.91 | 9333 | 9151 | 1908.9 |
| D | 13 | 88 | 2917051 | 1468.35 | 9296 | 8991 | 1980.5 |
| D | 2 | 89 | 566039 | 281.27 | 9296 | 8991 | 1980.5 |
| D | 10 | 85 | 535441 | 265.82 | 9296 | 8991 | 1980.5 |
Histogram calculated using DETX and DETY for each event in the final _common_clean file
| Quadrant A |  |
 |
Quadrant B |
|---|---|---|---|
| Quadrant D | 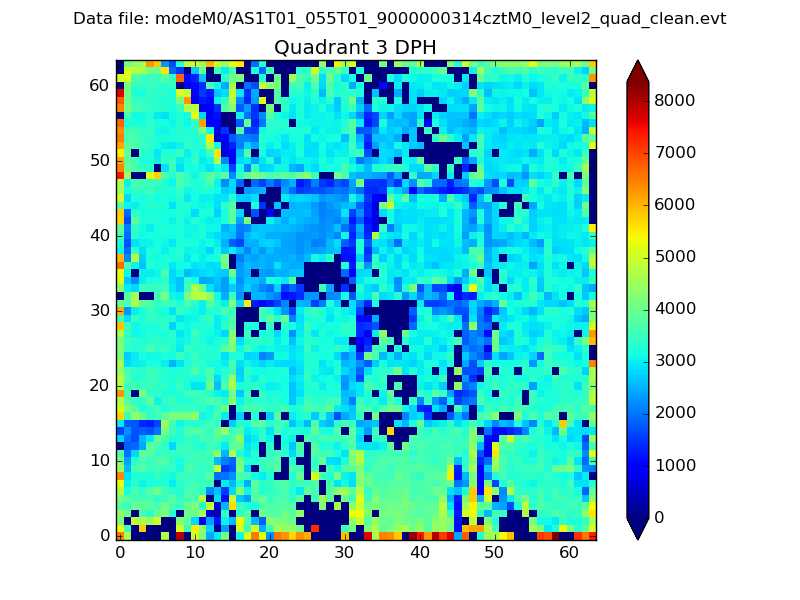 |
 |
Quadrant C |
| Plot type | Count rate plots | Images |
|---|---|---|
| Comparison with Poisson distribution Blue bars denote a histogram of data divided into 1 sec bins. Red curve is a Poisson curve with rate = median count rate of data. |
 |
 |
| Quadrant-wise count rates Data is divided into 100 sec bins |
 |
|
| Module-wise count rates for Quadrant A Data is divided into 100 sec bins |
 |
 |
| Module-wise count rates for Quadrant B Data is divided into 100 sec bins |
 |
 |
| Module-wise count rates for Quadrant C Data is divided into 100 sec bins |
 |
 |
| Module-wise count rates for Quadrant D Data is divided into 100 sec bins |
 |
 |
| Parameter | Plot |
|---|---|
| CZT HV Monitor | 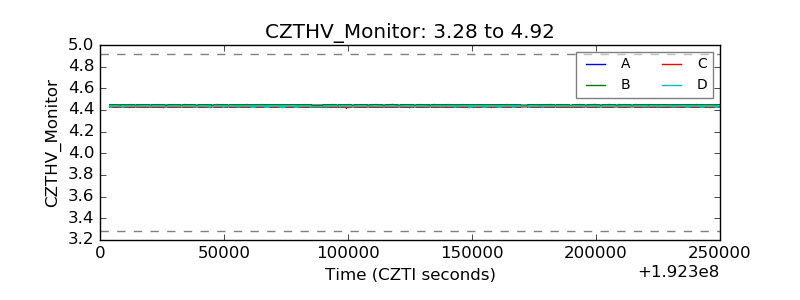 |
| D_VDD | 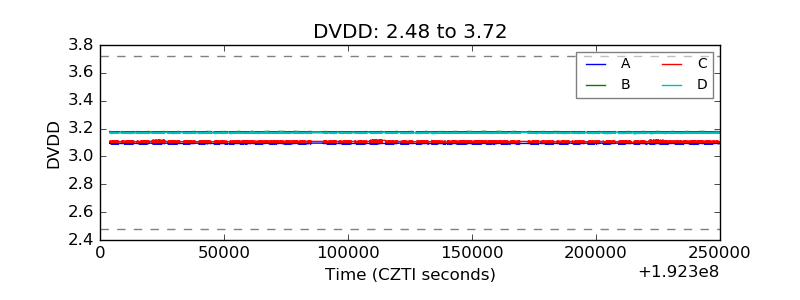 |
| Temperature 1 |  |
| Veto HV Monitor |  |
| Veto LLD |  |
| Alpha Counter | 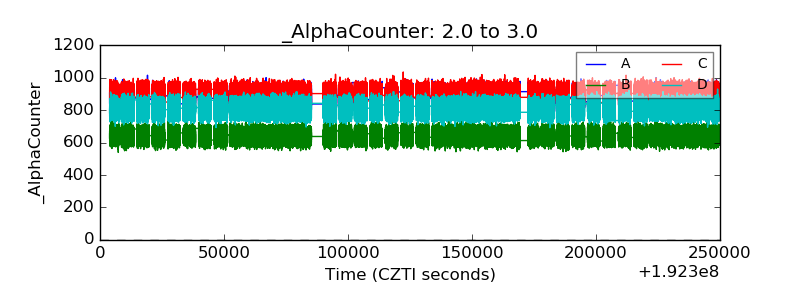 |
| _CPM_Rate |  |
| CZT Counter |  |
| +2.5 Volts monitor | 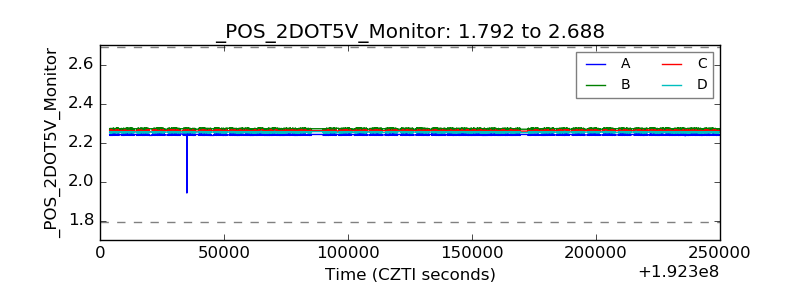 |
| +5 Volts monitor |  |
| Veto Counter |  |