| Param | Original file | Final file |
|---|---|---|
| Filename | modeM0/AS1T01_052T01_9000000312cztM0_level2.evt | modeM0/AS1T01_052T01_9000000312cztM0_level2_quad_clean.evt |
| Size (bytes) | 16,924,697,280 | 1,255,544,640 |
| Size | 15.8 GB | 1.2 GB |
| Events in quadrant A | 133,818,517 | 7,778,257 |
| Events in quadrant B | 131,352,395 | 7,967,202 |
| Events in quadrant C | 122,228,554 | 7,805,315 |
| Events in quadrant D | 118,386,735 | 7,410,668 |
| Mode M9 | |||
|---|---|---|---|
| Quadrant | BADHDUFLAG | Total packets | Discarded packets |
| A | 0 | 14 | 0 |
| B | 1 | 14 | 0 |
| C | 1 | 14 | 0 |
| D | 1 | 1 | 0 |
| Mode M0 | |||
|---|---|---|---|
| Quadrant | BADHDUFLAG | Total packets | Discarded packets |
| A | 0 | 470603 | 0 |
| B | 0 | 463438 | 0 |
| C | 0 | 436464 | 0 |
| D | 0 | 425262 | 0 |
| Mode SS | |||
|---|---|---|---|
| Quadrant | BADHDUFLAG | Total packets | Discarded packets |
| A | 0 | 2068 | 0 |
| B | 0 | 2068 | 0 |
| C | 0 | 2068 | 0 |
| D | 0 | 2068 | 0 |
| Quadrant | Total seconds | Saturated seconds | Saturation percentage |
|---|---|---|---|
| A | 103138 | 1056 | 1.023871% |
| B | 103140 | 835 | 0.809579% |
| C | 103140 | 460 | 0.445996% |
| D | 103136 | 1062 | 1.029708% |
Noise dominated data is calculated using 1-second bins in cleaned event files. If a bin has >2000 counts, and if more than 50% of those come from <1% of pixels, then it is considered to be noise-dominated and hence unusable.
| Quadrant | # 1 sec bins | Bins with >0 counts | Bins with >2000 counts | High rate bins dominated by noise | Noise dominated (total time) | Noise dominated (detector-on time) | Marked lightcurve |
|---|---|---|---|---|---|---|---|
| A | 115170 | 103160 | 6371 | 6371 | 5.53% | 6.18% |  |
| B | 115170 | 103162 | 5580 | 5580 | 4.85% | 5.41% | 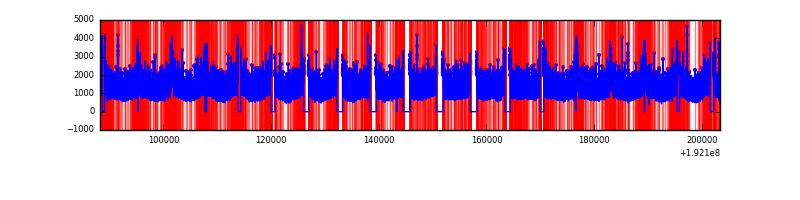 |
| C | 115170 | 103162 | 4172 | 4172 | 3.62% | 4.04% |  |
| D | 115170 | 103161 | 4581 | 4581 | 3.98% | 4.44% |  |
Top three noisy pixels from each quadrant. If the there are fewer than three noisy pixels in the level2.evt file, extra rows are filled as -1
| Pixel properties | Quadrant properties | ||||||
|---|---|---|---|---|---|---|---|
| Quadrant | DetID | PixID | Counts | Sigma | Mean | Median | Sigma |
| A | 0 | 231 | 6468750 | 808.41 | 32981 | 33220 | 7960.7 |
| A | 12 | 236 | 896927 | 108.5 | 32981 | 33220 | 7960.7 |
| A | 14 | 5 | 182672 | 18.77 | 32981 | 33220 | 7960.7 |
| B | 5 | 68 | 330546 | 36.77 | 34370 | 34565 | 8049.1 |
| B | 0 | 198 | 266238 | 28.78 | 34370 | 34565 | 8049.1 |
| B | 15 | 85 | 150512 | 14.41 | 34370 | 34565 | 8049.1 |
| C | 14 | 223 | 288255 | 29.47 | 31172 | 32296 | 8684.4 |
| C | 9 | 54 | 166798 | 15.49 | 31172 | 32296 | 8684.4 |
| C | 7 | 159 | 106830 | 8.58 | 31172 | 32296 | 8684.4 |
| D | 2 | 152 | 1810426 | 190.17 | 30229 | 31405 | 9354.7 |
| D | 13 | 53 | 810727 | 83.31 | 30229 | 31405 | 9354.7 |
| D | 13 | 105 | 464434 | 46.29 | 30229 | 31405 | 9354.7 |
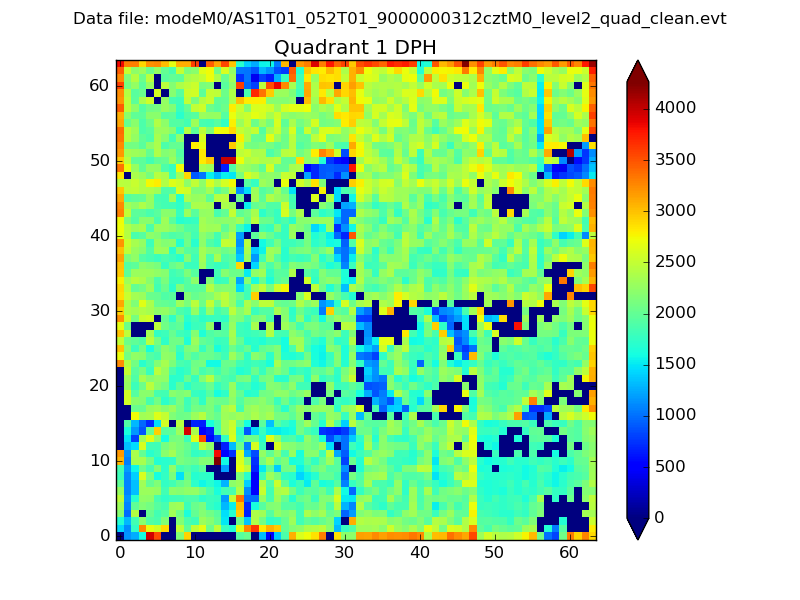
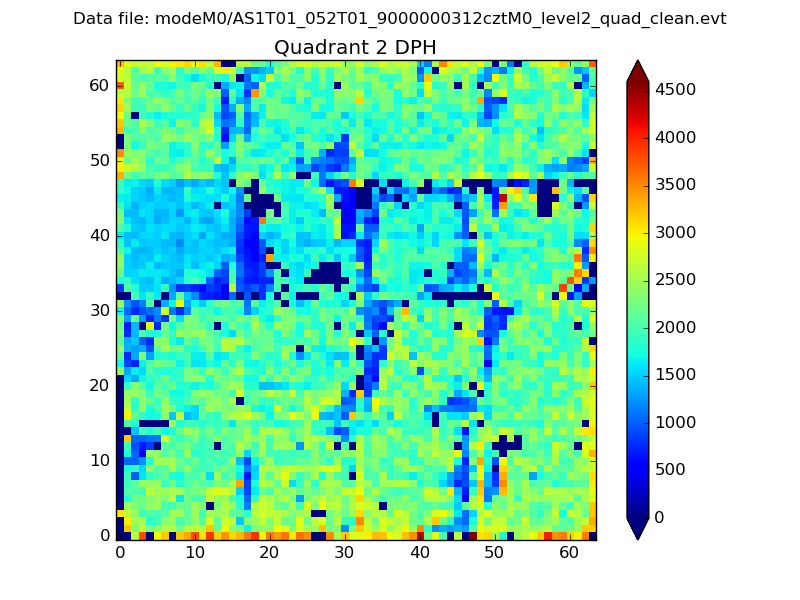
Histogram calculated using DETX and DETY for each event in the final _common_clean file
| Quadrant A |  |
 |
Quadrant B |
|---|---|---|---|
| Quadrant D | 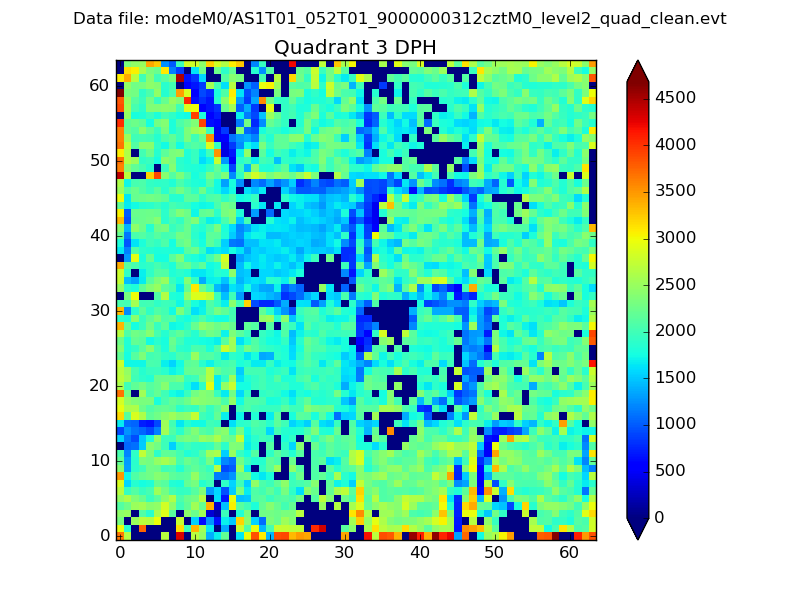 |
 |
Quadrant C |
| Plot type | Count rate plots | Images |
|---|---|---|
| Comparison with Poisson distribution Blue bars denote a histogram of data divided into 1 sec bins. Red curve is a Poisson curve with rate = median count rate of data. |
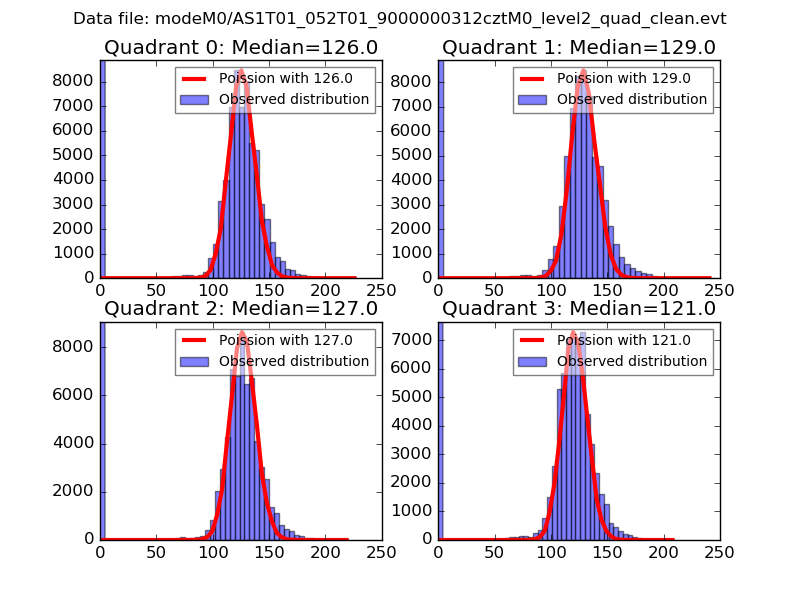 |
 |
| Quadrant-wise count rates Data is divided into 100 sec bins |
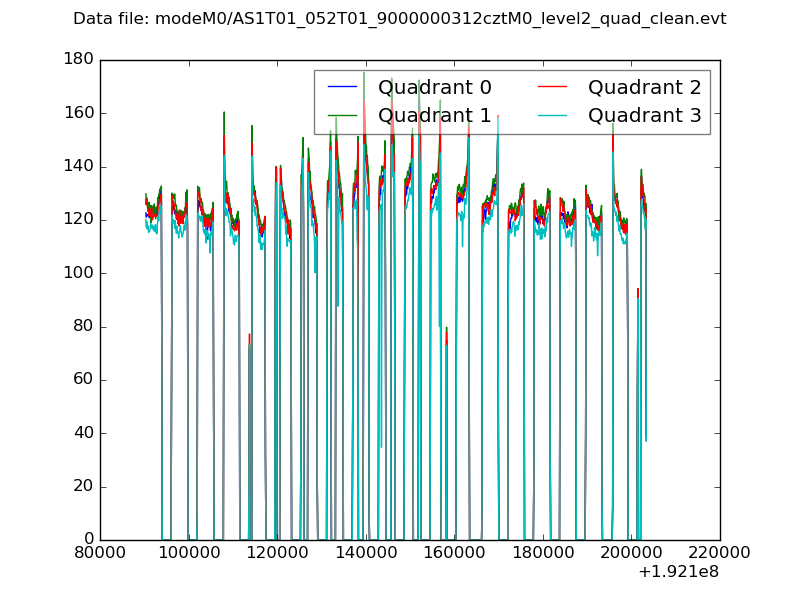 |
|
| Module-wise count rates for Quadrant A Data is divided into 100 sec bins |
 |
 |
| Module-wise count rates for Quadrant B Data is divided into 100 sec bins |
 |
 |
| Module-wise count rates for Quadrant C Data is divided into 100 sec bins |
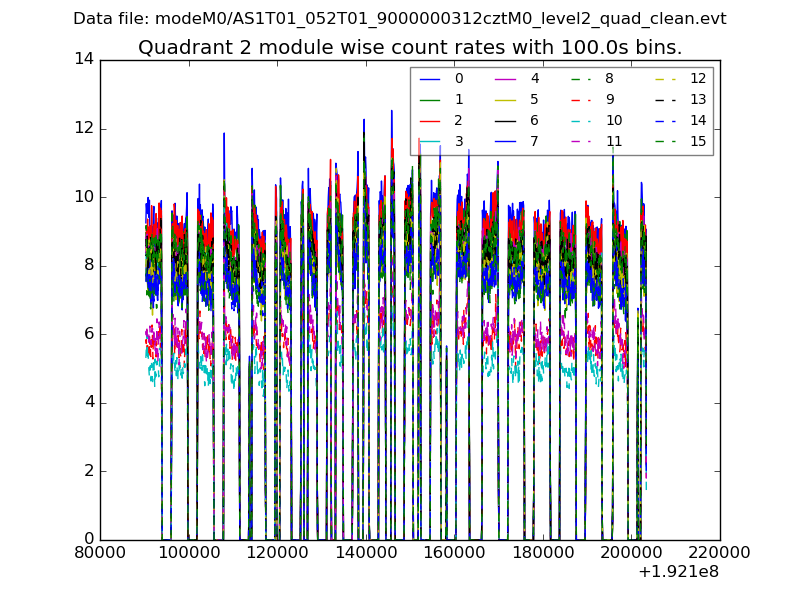 |
 |
| Module-wise count rates for Quadrant D Data is divided into 100 sec bins |
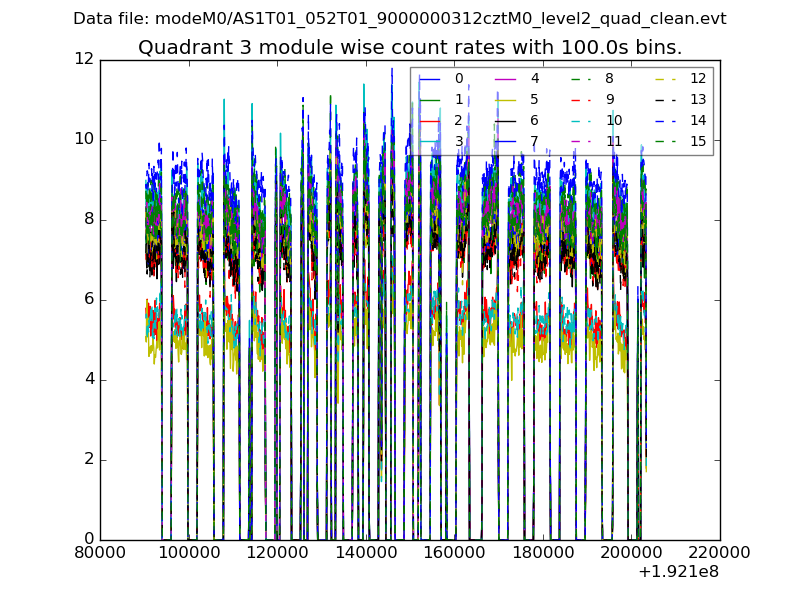 |
 |
| Parameter | Plot |
|---|---|
| CZT HV Monitor | 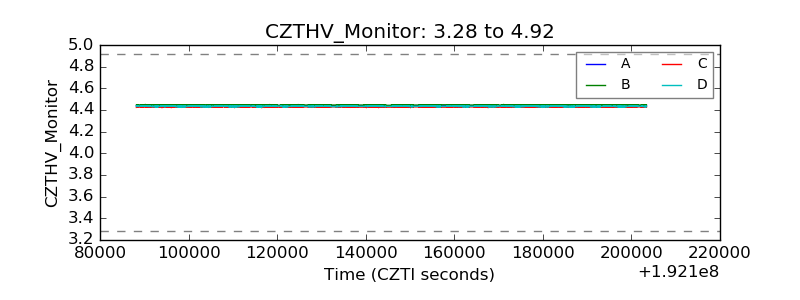 |
| D_VDD |  |
| Temperature 1 |  |
| Veto HV Monitor |  |
| Veto LLD |  |
| Alpha Counter |  |
| _CPM_Rate |  |
| CZT Counter |  |
| +2.5 Volts monitor |  |
| +5 Volts monitor |  |
| _ROLL_ROT | 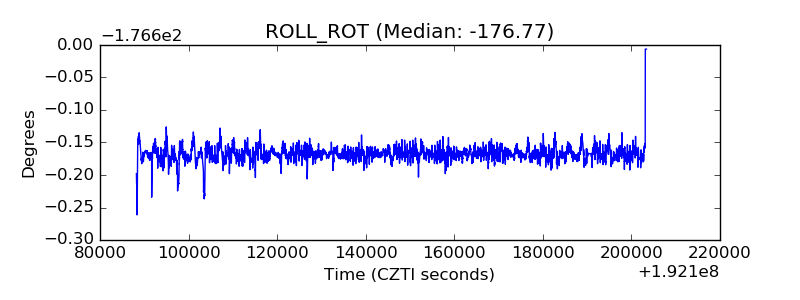 |
| _Roll_DEC |  |
| _Roll_RA |  |
| Veto Counter |  |