| Param | Original file | Final file |
|---|---|---|
| Filename | modeM0/AS1T01_054T01_9000000310cztM0_level2.evt | modeM0/AS1T01_054T01_9000000310cztM0_level2_quad_clean.evt |
| Size (bytes) | 17,062,303,680 | 1,192,642,560 |
| Size | 15.9 GB | 1.1 GB |
| Events in quadrant A | 139,456,168 | 7,285,180 |
| Events in quadrant B | 131,010,863 | 7,424,130 |
| Events in quadrant C | 121,432,409 | 7,275,473 |
| Events in quadrant D | 118,038,165 | 7,051,921 |
| Mode SS | |||
|---|---|---|---|
| Quadrant | BADHDUFLAG | Total packets | Discarded packets |
| A | 0 | 2074 | 0 |
| B | 0 | 2074 | 0 |
| C | 0 | 2074 | 0 |
| D | 0 | 2074 | 0 |
| Mode M0 | |||
|---|---|---|---|
| Quadrant | BADHDUFLAG | Total packets | Discarded packets |
| A | 0 | 487582 | 0 |
| B | 0 | 462490 | 0 |
| C | 0 | 434133 | 0 |
| D | 0 | 424386 | 0 |
| Mode M9 | |||
|---|---|---|---|
| Quadrant | BADHDUFLAG | Total packets | Discarded packets |
| A | 0 | 18 | 0 |
| B | 1 | 18 | 0 |
| C | 1 | 18 | 0 |
| D | 1 | 1 | 0 |
| Quadrant | Total seconds | Saturated seconds | Saturation percentage |
|---|---|---|---|
| A | 103418 | 1169 | 1.130364% |
| B | 103426 | 799 | 0.772533% |
| C | 103420 | 460 | 0.444788% |
| D | 103414 | 1048 | 1.013402% |
Noise dominated data is calculated using 1-second bins in cleaned event files. If a bin has >2000 counts, and if more than 50% of those come from <1% of pixels, then it is considered to be noise-dominated and hence unusable.
| Quadrant | # 1 sec bins | Bins with >0 counts | Bins with >2000 counts | High rate bins dominated by noise | Noise dominated (total time) | Noise dominated (detector-on time) | Marked lightcurve |
|---|---|---|---|---|---|---|---|
| A | 120323 | 103444 | 7136 | 7136 | 5.93% | 6.90% |  |
| B | 120323 | 103448 | 4728 | 4728 | 3.93% | 4.57% | 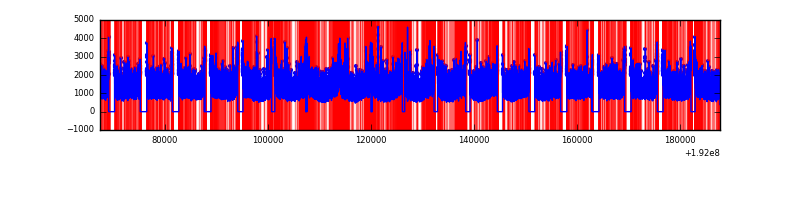 |
| C | 120323 | 103446 | 3495 | 3495 | 2.90% | 3.38% |  |
| D | 120323 | 103443 | 4067 | 4067 | 3.38% | 3.93% | 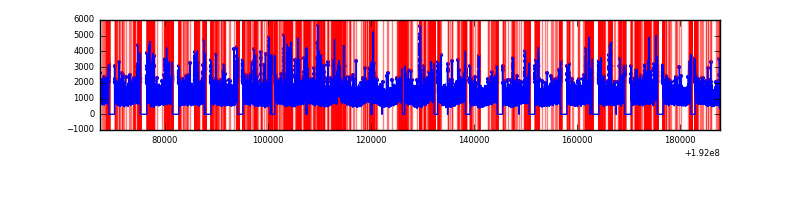 |
Top three noisy pixels from each quadrant. If the there are fewer than three noisy pixels in the level2.evt file, extra rows are filled as -1
| Pixel properties | Quadrant properties | ||||||
|---|---|---|---|---|---|---|---|
| Quadrant | DetID | PixID | Counts | Sigma | Mean | Median | Sigma |
| A | 0 | 231 | 9856397 | 1237.01 | 32953 | 33226 | 7941.1 |
| A | 0 | 128 | 3330480 | 415.21 | 32953 | 33226 | 7941.1 |
| A | 14 | 5 | 135823 | 12.92 | 32953 | 33226 | 7941.1 |
| B | 5 | 200 | 376774 | 42.41 | 34292 | 34487 | 8070.6 |
| B | 0 | 220 | 218669 | 22.82 | 34292 | 34487 | 8070.6 |
| B | 5 | 189 | 182348 | 18.32 | 34292 | 34487 | 8070.6 |
| C | 9 | 54 | 185044 | 17.71 | 30977 | 32067 | 8637.0 |
| C | 1 | 192 | 124995 | 10.76 | 30977 | 32067 | 8637.0 |
| C | 10 | 34 | 114345 | 9.53 | 30977 | 32067 | 8637.0 |
| D | 13 | 105 | 1262032 | 130.15 | 30217 | 31374 | 9455.9 |
| D | 7 | 34 | 893801 | 91.21 | 30217 | 31374 | 9455.9 |
| D | 1 | 83 | 820748 | 83.48 | 30217 | 31374 | 9455.9 |
Histogram calculated using DETX and DETY for each event in the final _common_clean file
| Quadrant A |  |
 |
Quadrant B |
|---|---|---|---|
| Quadrant D | 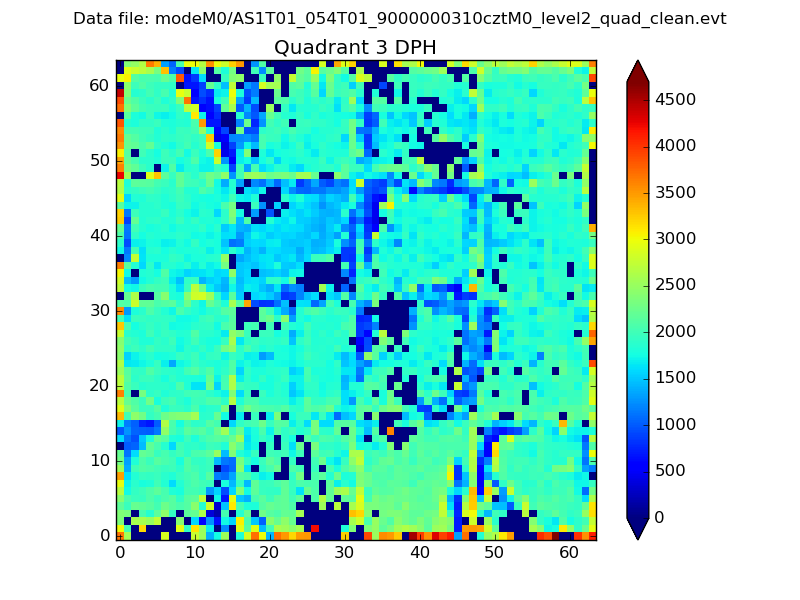 |
 |
Quadrant C |
| Plot type | Count rate plots | Images |
|---|---|---|
| Comparison with Poisson distribution Blue bars denote a histogram of data divided into 1 sec bins. Red curve is a Poisson curve with rate = median count rate of data. |
 |
 |
| Quadrant-wise count rates Data is divided into 100 sec bins |
 |
|
| Module-wise count rates for Quadrant A Data is divided into 100 sec bins |
 |
 |
| Module-wise count rates for Quadrant B Data is divided into 100 sec bins |
 |
 |
| Module-wise count rates for Quadrant C Data is divided into 100 sec bins |
 |
 |
| Module-wise count rates for Quadrant D Data is divided into 100 sec bins |
 |
 |
| Parameter | Plot |
|---|---|
| CZT HV Monitor |  |
| D_VDD |  |
| Temperature 1 |  |
| Veto HV Monitor |  |
| Veto LLD |  |
| Alpha Counter | 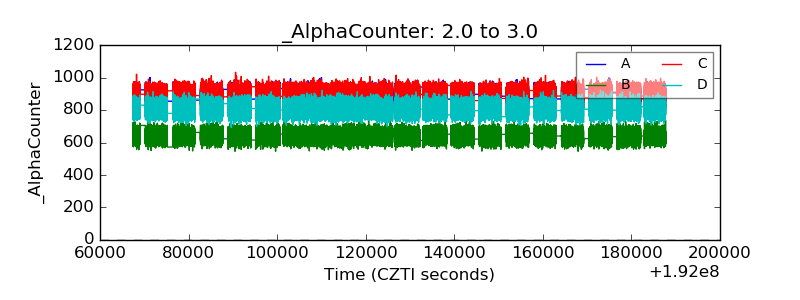 |
| _CPM_Rate |  |
| CZT Counter |  |
| +2.5 Volts monitor |  |
| +5 Volts monitor | 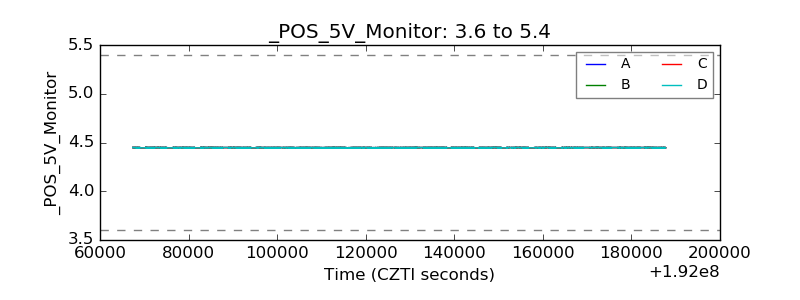 |
| _ROLL_ROT |  |
| _Roll_DEC |  |
| _Roll_RA |  |
| Veto Counter |  |