| Param | Original file | Final file |
|---|---|---|
| Filename | modeM0/AS1T01_052T01_9000000308cztM0_level2.evt | modeM0/AS1T01_052T01_9000000308cztM0_level2_quad_clean.evt |
| Size (bytes) | 13,947,791,040 | 981,169,920 |
| Size | 13.0 GB | 935.7 MB |
| Events in quadrant A | 119,057,453 | 6,008,261 |
| Events in quadrant B | 104,840,649 | 6,176,891 |
| Events in quadrant C | 97,998,366 | 6,050,294 |
| Events in quadrant D | 95,101,355 | 5,832,510 |
| Mode M9 | |||
|---|---|---|---|
| Quadrant | BADHDUFLAG | Total packets | Discarded packets |
| A | 0 | 13 | 0 |
| B | 1 | 13 | 0 |
| C | 1 | 13 | 0 |
| D | 1 | 1 | 0 |
| Mode M0 | |||
|---|---|---|---|
| Quadrant | BADHDUFLAG | Total packets | Discarded packets |
| A | 0 | 411994 | 0 |
| B | 0 | 369955 | 0 |
| C | 0 | 349651 | 0 |
| D | 0 | 341236 | 0 |
| Mode SS | |||
|---|---|---|---|
| Quadrant | BADHDUFLAG | Total packets | Discarded packets |
| A | 0 | 1648 | 0 |
| B | 0 | 1648 | 0 |
| C | 0 | 1648 | 0 |
| D | 0 | 1648 | 0 |
| Quadrant | Total seconds | Saturated seconds | Saturation percentage |
|---|---|---|---|
| A | 82448 | 1436 | 1.741704% |
| B | 82454 | 786 | 0.953259% |
| C | 82452 | 737 | 0.893853% |
| D | 82453 | 927 | 1.124277% |
Noise dominated data is calculated using 1-second bins in cleaned event files. If a bin has >2000 counts, and if more than 50% of those come from <1% of pixels, then it is considered to be noise-dominated and hence unusable.
| Quadrant | # 1 sec bins | Bins with >0 counts | Bins with >2000 counts | High rate bins dominated by noise | Noise dominated (total time) | Noise dominated (detector-on time) | Marked lightcurve |
|---|---|---|---|---|---|---|---|
| A | 112511 | 82470 | 7488 | 7488 | 6.66% | 9.08% |  |
| B | 112511 | 82473 | 4303 | 4303 | 3.82% | 5.22% | 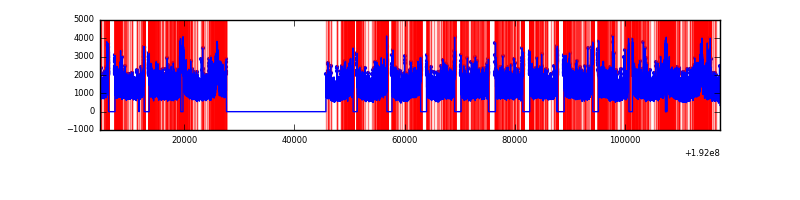 |
| C | 112511 | 82473 | 3565 | 3565 | 3.17% | 4.32% |  |
| D | 112511 | 82474 | 3812 | 3812 | 3.39% | 4.62% |  |
Top three noisy pixels from each quadrant. If the there are fewer than three noisy pixels in the level2.evt file, extra rows are filled as -1
| Pixel properties | Quadrant properties | ||||||
|---|---|---|---|---|---|---|---|
| Quadrant | DetID | PixID | Counts | Sigma | Mean | Median | Sigma |
| A | 0 | 231 | 14755317 | 2325.71 | 26283 | 26488 | 6333.0 |
| A | 0 | 128 | 3747819 | 587.61 | 26283 | 26488 | 6333.0 |
| A | 13 | 170 | 120401 | 14.83 | 26283 | 26488 | 6333.0 |
| B | 5 | 200 | 267369 | 37.28 | 27411 | 27558 | 6432.7 |
| B | 8 | 3 | 246688 | 34.07 | 27411 | 27558 | 6432.7 |
| B | 3 | 0 | 167799 | 21.8 | 27411 | 27558 | 6432.7 |
| C | 2 | 53 | 985343 | 138.85 | 24753 | 25627 | 6912.0 |
| C | 9 | 236 | 145824 | 17.39 | 24753 | 25627 | 6912.0 |
| C | 14 | 223 | 127200 | 14.7 | 24753 | 25627 | 6912.0 |
| D | 1 | 83 | 1394916 | 182.34 | 24176 | 25127 | 7512.1 |
| D | 9 | 66 | 534650 | 67.83 | 24176 | 25127 | 7512.1 |
| D | 13 | 53 | 480877 | 60.67 | 24176 | 25127 | 7512.1 |
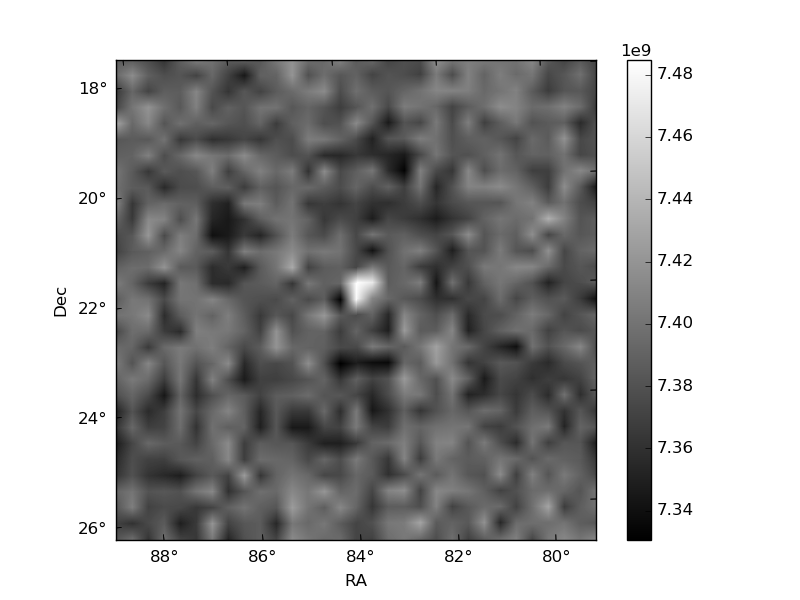
Histogram calculated using DETX and DETY for each event in the final _common_clean file
| Quadrant A |  |
 |
Quadrant B |
|---|---|---|---|
| Quadrant D |  |
 |
Quadrant C |
| Plot type | Count rate plots | Images |
|---|---|---|
| Comparison with Poisson distribution Blue bars denote a histogram of data divided into 1 sec bins. Red curve is a Poisson curve with rate = median count rate of data. |
 |
 |
| Quadrant-wise count rates Data is divided into 100 sec bins |
 |
|
| Module-wise count rates for Quadrant A Data is divided into 100 sec bins |
 |
 |
| Module-wise count rates for Quadrant B Data is divided into 100 sec bins |
 |
 |
| Module-wise count rates for Quadrant C Data is divided into 100 sec bins |
 |
 |
| Module-wise count rates for Quadrant D Data is divided into 100 sec bins |
 |
 |
| Parameter | Plot |
|---|---|
| CZT HV Monitor |  |
| D_VDD |  |
| Temperature 1 | 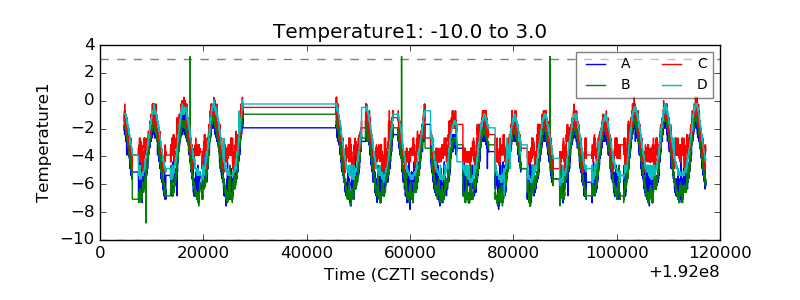 |
| Veto HV Monitor | 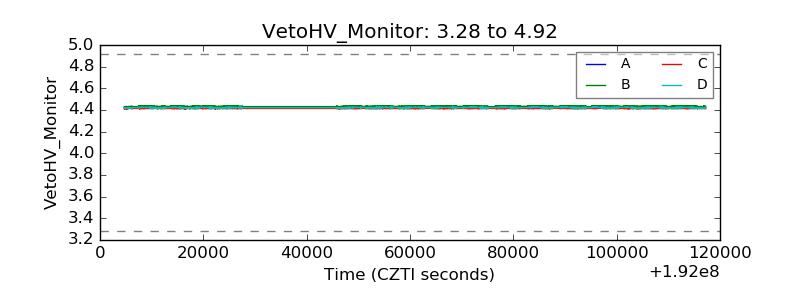 |
| Veto LLD | 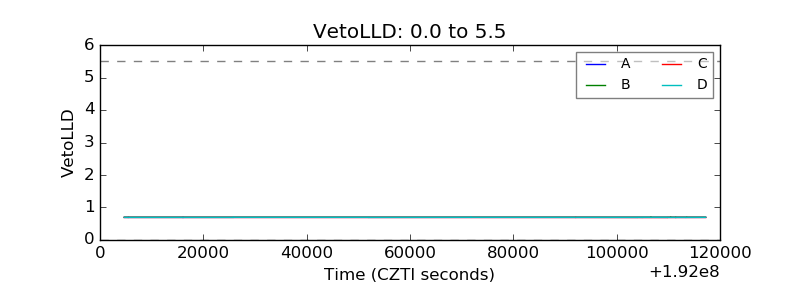 |
| Alpha Counter | 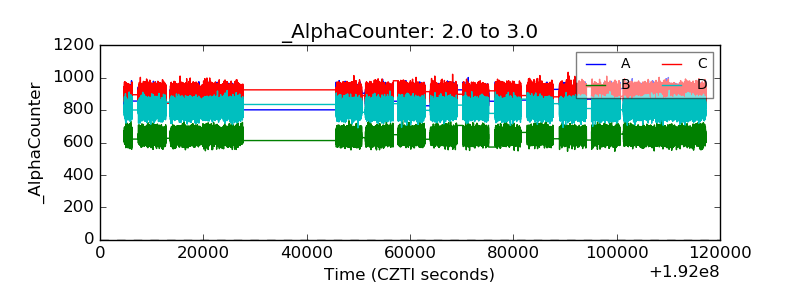 |
| _CPM_Rate |  |
| CZT Counter | 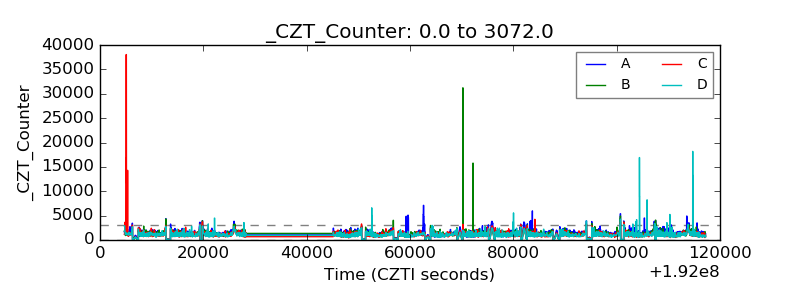 |
| +2.5 Volts monitor | 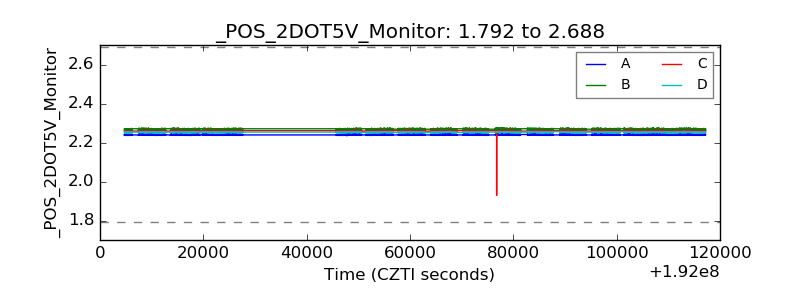 |
| +5 Volts monitor |  |
| _ROLL_ROT |  |
| _Roll_DEC | 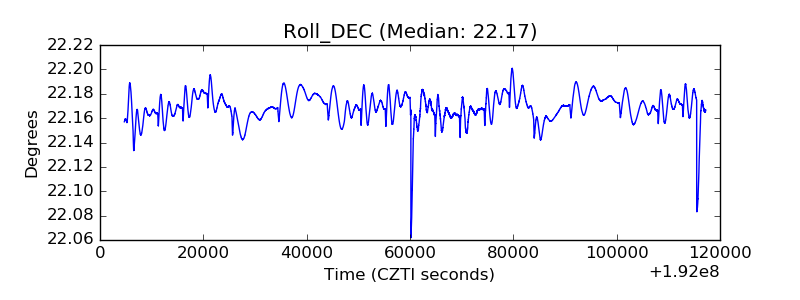 |
| _Roll_RA |  |
| Veto Counter |  |