| Param | Original file | Final file |
|---|---|---|
| Filename | modeM0/AS1G02_021T07_9000000306cztM0_level2.evt | modeM0/AS1G02_021T07_9000000306cztM0_level2_quad_clean.evt |
| Size (bytes) | 3,864,450,240 | 280,440,000 |
| Size | 3.6 GB | 267.4 MB |
| Events in quadrant A | 29,841,855 | 1,739,002 |
| Events in quadrant B | 30,014,514 | 1,762,041 |
| Events in quadrant C | 28,491,328 | 1,725,647 |
| Events in quadrant D | 27,163,655 | 1,674,025 |
| Mode SS | |||
|---|---|---|---|
| Quadrant | BADHDUFLAG | Total packets | Discarded packets |
| A | 0 | 691 | 0 |
| B | 0 | 636 | 0 |
| C | 0 | 658 | 0 |
| D | 0 | 517 | 0 |
| Mode M9 | |||
|---|---|---|---|
| Quadrant | BADHDUFLAG | Total packets | Discarded packets |
| A | 0 | 7 | 0 |
| B | 1 | 7 | 0 |
| C | 1 | 7 | 0 |
| D | 1 | 1 | 0 |
| Mode M0 | |||
|---|---|---|---|
| Quadrant | BADHDUFLAG | Total packets | Discarded packets |
| A | 0 | 104891 | 0 |
| B | 0 | 105383 | 0 |
| C | 0 | 100987 | 0 |
| D | 0 | 97027 | 0 |
| Quadrant | Total seconds | Saturated seconds | Saturation percentage |
|---|---|---|---|
| A | 22824 | 376 | 1.647389% |
| B | 22815 | 407 | 1.783914% |
| C | 22828 | 392 | 1.717189% |
| D | 22845 | 363 | 1.588969% |
Noise dominated data is calculated using 1-second bins in cleaned event files. If a bin has >2000 counts, and if more than 50% of those come from <1% of pixels, then it is considered to be noise-dominated and hence unusable.
| Quadrant | # 1 sec bins | Bins with >0 counts | Bins with >2000 counts | High rate bins dominated by noise | Noise dominated (total time) | Noise dominated (detector-on time) | Marked lightcurve |
|---|---|---|---|---|---|---|---|
| A | 72582 | 22840 | 1685 | 1685 | 2.32% | 7.38% |  |
| B | 72582 | 22823 | 1680 | 1680 | 2.31% | 7.36% | 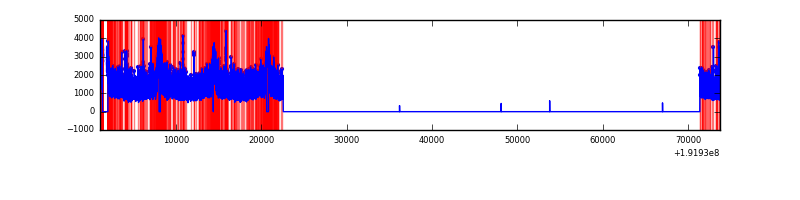 |
| C | 72582 | 22852 | 1737 | 1737 | 2.39% | 7.60% | 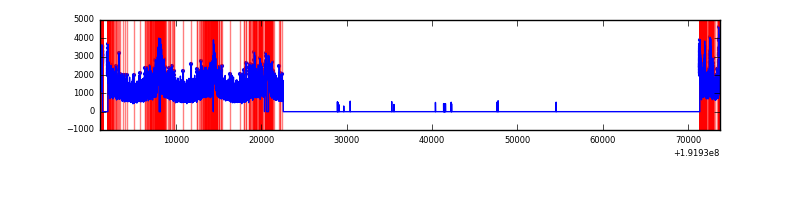 |
| D | 72582 | 22879 | 1557 | 1557 | 2.15% | 6.81% | 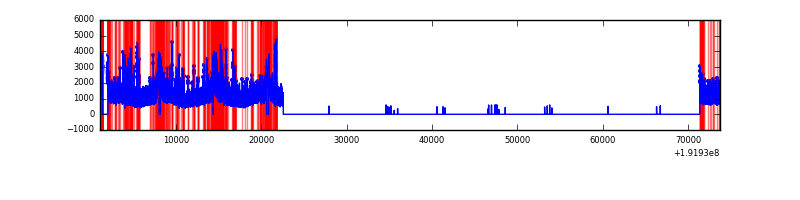 |
Top three noisy pixels from each quadrant. If the there are fewer than three noisy pixels in the level2.evt file, extra rows are filled as -1
| Pixel properties | Quadrant properties | ||||||
|---|---|---|---|---|---|---|---|
| Quadrant | DetID | PixID | Counts | Sigma | Mean | Median | Sigma |
| A | 0 | 231 | 845694 | 464.52 | 7488 | 7513 | 1804.4 |
| A | 15 | 175 | 352034 | 190.93 | 7488 | 7513 | 1804.4 |
| A | 10 | 2 | 28966 | 11.89 | 7488 | 7513 | 1804.4 |
| B | 8 | 3 | 138936 | 70.82 | 7774 | 7789 | 1851.8 |
| B | 12 | 67 | 107211 | 53.69 | 7774 | 7789 | 1851.8 |
| B | 0 | 198 | 106082 | 53.08 | 7774 | 7789 | 1851.8 |
| C | 8 | 208 | 809157 | 407.89 | 7038 | 7277 | 1965.9 |
| C | 9 | 85 | 87033 | 40.57 | 7038 | 7277 | 1965.9 |
| C | 14 | 223 | 53257 | 23.39 | 7038 | 7277 | 1965.9 |
| D | 2 | 32 | 559330 | 259.2 | 6864 | 7104 | 2130.5 |
| D | 1 | 83 | 247588 | 112.88 | 6864 | 7104 | 2130.5 |
| D | 10 | 85 | 228835 | 104.07 | 6864 | 7104 | 2130.5 |
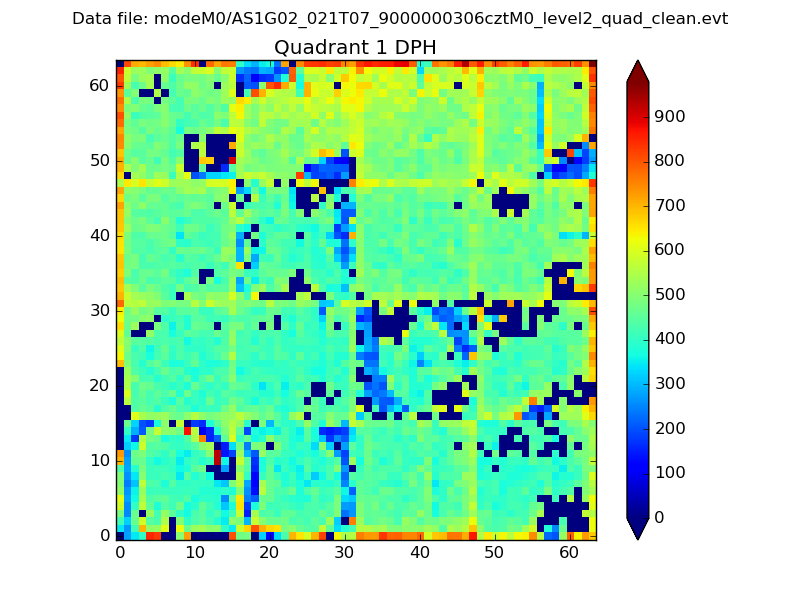
Histogram calculated using DETX and DETY for each event in the final _common_clean file
| Quadrant A |  |
 |
Quadrant B |
|---|---|---|---|
| Quadrant D |  |
 |
Quadrant C |
| Plot type | Count rate plots | Images |
|---|---|---|
| Comparison with Poisson distribution Blue bars denote a histogram of data divided into 1 sec bins. Red curve is a Poisson curve with rate = median count rate of data. |
 |
 |
| Quadrant-wise count rates Data is divided into 100 sec bins |
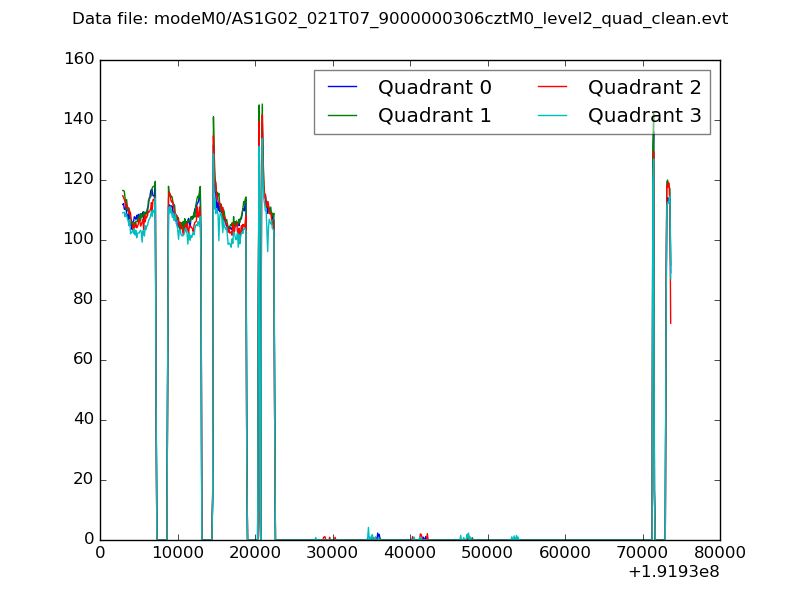 |
|
| Module-wise count rates for Quadrant A Data is divided into 100 sec bins |
 |
 |
| Module-wise count rates for Quadrant B Data is divided into 100 sec bins |
 |
 |
| Module-wise count rates for Quadrant C Data is divided into 100 sec bins |
 |
 |
| Module-wise count rates for Quadrant D Data is divided into 100 sec bins |
 |
 |
| Parameter | Plot |
|---|---|
| CZT HV Monitor | 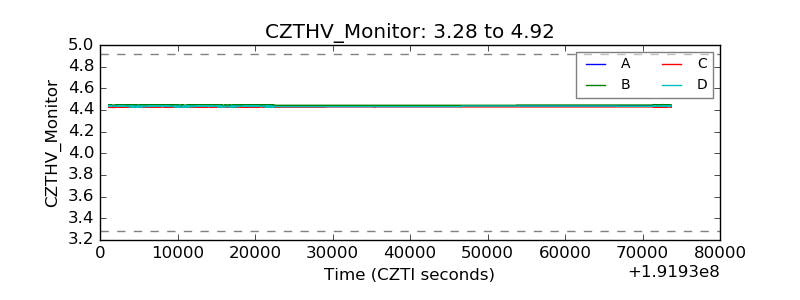 |
| D_VDD |  |
| Temperature 1 |  |
| Veto HV Monitor |  |
| Veto LLD | 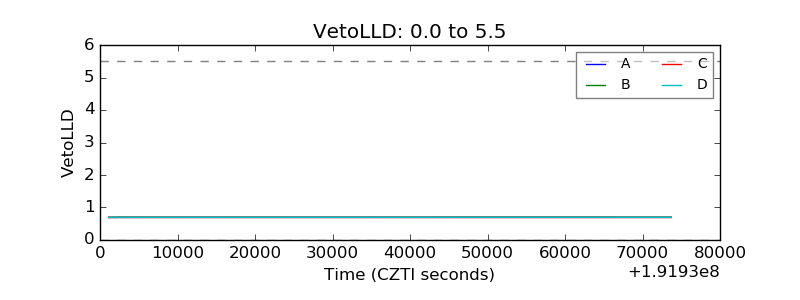 |
| Alpha Counter |  |
| _CPM_Rate |  |
| CZT Counter |  |
| +2.5 Volts monitor |  |
| +5 Volts monitor |  |
| _ROLL_ROT |  |
| _Roll_DEC |  |
| _Roll_RA |  |
| Veto Counter |  |