| Param | Original file | Final file |
|---|---|---|
| Filename | modeM0/AS1G02_021T10_9000000304cztM0_level2.evt | modeM0/AS1G02_021T10_9000000304cztM0_level2_quad_clean.evt |
| Size (bytes) | 16,600,881,600 | 1,187,714,880 |
| Size | 15.5 GB | 1.1 GB |
| Events in quadrant A | 127,335,829 | 7,196,035 |
| Events in quadrant B | 130,238,759 | 7,358,678 |
| Events in quadrant C | 121,103,445 | 7,206,050 |
| Events in quadrant D | 117,156,320 | 7,005,249 |
| Mode SS | |||
|---|---|---|---|
| Quadrant | BADHDUFLAG | Total packets | Discarded packets |
| A | 0 | 2104 | 0 |
| B | 0 | 2104 | 0 |
| C | 0 | 2104 | 0 |
| D | 0 | 2104 | 0 |
| Mode M0 | |||
|---|---|---|---|
| Quadrant | BADHDUFLAG | Total packets | Discarded packets |
| A | 0 | 452982 | 0 |
| B | 0 | 461435 | 0 |
| C | 0 | 434671 | 0 |
| D | 0 | 423374 | 0 |
| Mode M9 | |||
|---|---|---|---|
| Quadrant | BADHDUFLAG | Total packets | Discarded packets |
| A | 0 | 15 | 0 |
| B | 1 | 15 | 0 |
| C | 1 | 15 | 0 |
| D | 1 | 1 | 0 |
| Quadrant | Total seconds | Saturated seconds | Saturation percentage |
|---|---|---|---|
| A | 105194 | 674 | 0.640721% |
| B | 105189 | 573 | 0.544734% |
| C | 105192 | 485 | 0.461062% |
| D | 105196 | 1064 | 1.011445% |
Noise dominated data is calculated using 1-second bins in cleaned event files. If a bin has >2000 counts, and if more than 50% of those come from <1% of pixels, then it is considered to be noise-dominated and hence unusable.
| Quadrant | # 1 sec bins | Bins with >0 counts | Bins with >2000 counts | High rate bins dominated by noise | Noise dominated (total time) | Noise dominated (detector-on time) | Marked lightcurve |
|---|---|---|---|---|---|---|---|
| A | 122374 | 105217 | 4319 | 4319 | 3.53% | 4.10% |  |
| B | 122374 | 105217 | 4244 | 4244 | 3.47% | 4.03% |  |
| C | 122374 | 105219 | 3146 | 3146 | 2.57% | 2.99% |  |
| D | 122374 | 105220 | 3746 | 3746 | 3.06% | 3.56% | 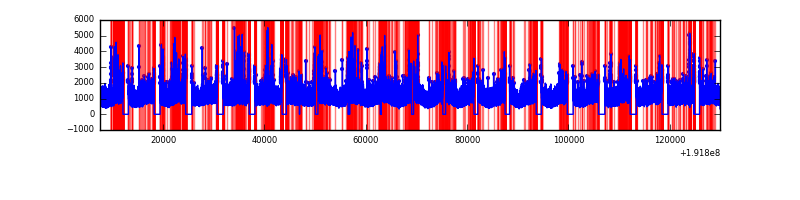 |
Top three noisy pixels from each quadrant. If the there are fewer than three noisy pixels in the level2.evt file, extra rows are filled as -1
| Pixel properties | Quadrant properties | ||||||
|---|---|---|---|---|---|---|---|
| Quadrant | DetID | PixID | Counts | Sigma | Mean | Median | Sigma |
| A | 0 | 128 | 1042345 | 128.0 | 32807 | 33031 | 7885.0 |
| A | 15 | 236 | 527695 | 62.74 | 32807 | 33031 | 7885.0 |
| A | 0 | 231 | 311590 | 35.33 | 32807 | 33031 | 7885.0 |
| B | 8 | 3 | 710208 | 84.63 | 33988 | 34140 | 7988.0 |
| B | 4 | 48 | 323298 | 36.2 | 33988 | 34140 | 7988.0 |
| B | 5 | 189 | 188484 | 19.32 | 33988 | 34140 | 7988.0 |
| C | 9 | 236 | 314260 | 32.67 | 30867 | 31994 | 8639.0 |
| C | 8 | 208 | 124965 | 10.76 | 30867 | 31994 | 8639.0 |
| C | 12 | 4 | 108104 | 8.81 | 30867 | 31994 | 8639.0 |
| D | 1 | 84 | 1247050 | 130.91 | 30053 | 31220 | 9287.4 |
| D | 1 | 83 | 1212466 | 127.19 | 30053 | 31220 | 9287.4 |
| D | 10 | 172 | 538412 | 54.61 | 30053 | 31220 | 9287.4 |
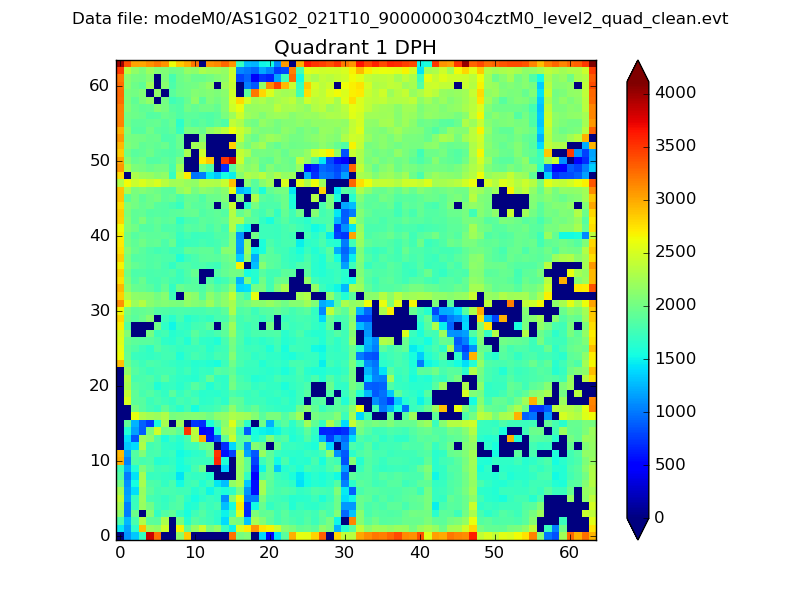
Histogram calculated using DETX and DETY for each event in the final _common_clean file
| Quadrant A |  |
 |
Quadrant B |
|---|---|---|---|
| Quadrant D |  |
 |
Quadrant C |
| Plot type | Count rate plots | Images |
|---|---|---|
| Comparison with Poisson distribution Blue bars denote a histogram of data divided into 1 sec bins. Red curve is a Poisson curve with rate = median count rate of data. |
 |
 |
| Quadrant-wise count rates Data is divided into 100 sec bins |
 |
|
| Module-wise count rates for Quadrant A Data is divided into 100 sec bins |
 |
 |
| Module-wise count rates for Quadrant B Data is divided into 100 sec bins |
 |
 |
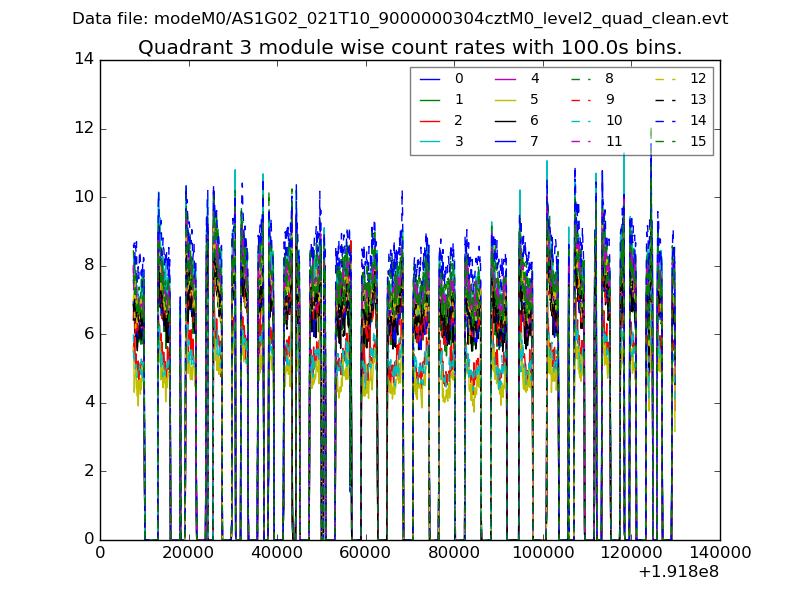
| Module-wise count rates for Quadrant C Data is divided into 100 sec bins |
 |
 |
| Module-wise count rates for Quadrant D Data is divided into 100 sec bins |
 |
 |
| Parameter | Plot |
|---|---|
| CZT HV Monitor | 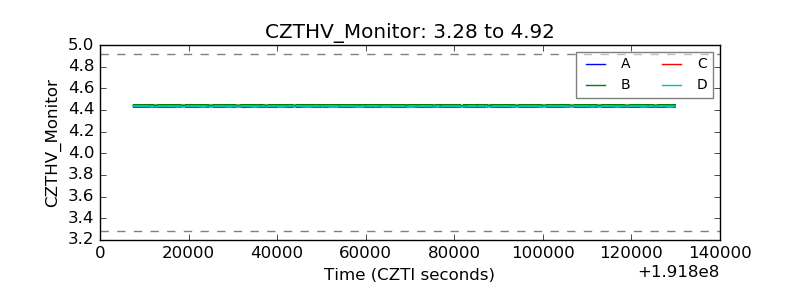 |
| D_VDD |  |
| Temperature 1 |  |
| Veto HV Monitor |  |
| Veto LLD |  |
| Alpha Counter | 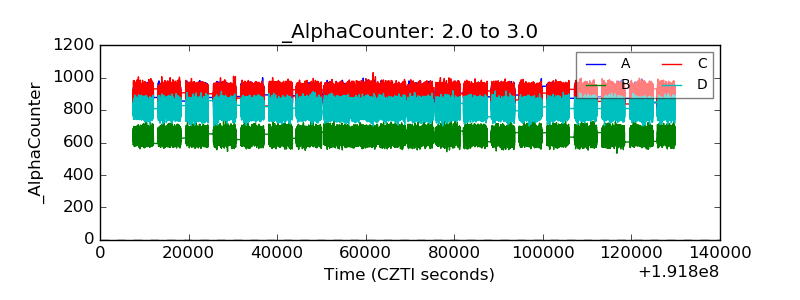 |
| _CPM_Rate |  |
| CZT Counter |  |
| +2.5 Volts monitor |  |
| +5 Volts monitor |  |
| _ROLL_ROT |  |
| _Roll_DEC |  |
| _Roll_RA |  |
| Veto Counter |  |