| Param | Original file | Final file |
|---|---|---|
| Filename | modeM0/AS1G02_021T08_9000000302cztM0_level2.evt | modeM0/AS1G02_021T08_9000000302cztM0_level2_quad_clean.evt |
| Size (bytes) | 8,672,791,680 | 615,597,120 |
| Size | 8.1 GB | 587.1 MB |
| Events in quadrant A | 63,442,287 | 3,770,420 |
| Events in quadrant B | 74,948,526 | 3,806,818 |
| Events in quadrant C | 61,283,804 | 3,773,140 |
| Events in quadrant D | 59,516,033 | 3,679,709 |
| Mode SS | |||
|---|---|---|---|
| Quadrant | BADHDUFLAG | Total packets | Discarded packets |
| A | 0 | 1058 | 0 |
| B | 0 | 1058 | 0 |
| C | 0 | 1057 | 0 |
| D | 0 | 1058 | 0 |
| Mode M0 | |||
|---|---|---|---|
| Quadrant | BADHDUFLAG | Total packets | Discarded packets |
| A | 0 | 225905 | 0 |
| B | 0 | 259983 | 0 |
| C | 0 | 219534 | 0 |
| D | 0 | 214540 | 0 |
| Mode M9 | |||
|---|---|---|---|
| Quadrant | BADHDUFLAG | Total packets | Discarded packets |
| A | 1 | 273359709408 | 0 |
| B | 1 | 273359709408 | 0 |
| C | 1 | 273359709408 | 0 |
| D | 1 | 273359709408 | 0 |
| Quadrant | Total seconds | Saturated seconds | Saturation percentage |
|---|---|---|---|
| A | 52694 | 344 | 0.652826% |
| B | 52690 | 1219 | 2.313532% |
| C | 52692 | 302 | 0.573142% |
| D | 52692 | 668 | 1.267745% |
Noise dominated data is calculated using 1-second bins in cleaned event files. If a bin has >2000 counts, and if more than 50% of those come from <1% of pixels, then it is considered to be noise-dominated and hence unusable.
| Quadrant | # 1 sec bins | Bins with >0 counts | Bins with >2000 counts | High rate bins dominated by noise | Noise dominated (total time) | Noise dominated (detector-on time) | Marked lightcurve |
|---|---|---|---|---|---|---|---|
| A | 59451 | 52709 | 2250 | 2250 | 3.78% | 4.27% |  |
| B | 59451 | 52707 | 6941 | 6941 | 11.68% | 13.17% |  |
| C | 59451 | 52707 | 1901 | 1901 | 3.20% | 3.61% |  |
| D | 59451 | 52706 | 2300 | 2300 | 3.87% | 4.36% |  |
Top three noisy pixels from each quadrant. If the there are fewer than three noisy pixels in the level2.evt file, extra rows are filled as -1
| Pixel properties | Quadrant properties | ||||||
|---|---|---|---|---|---|---|---|
| Quadrant | DetID | PixID | Counts | Sigma | Mean | Median | Sigma |
| A | 15 | 236 | 63805 | 11.77 | 16571 | 16680 | 4003.5 |
| A | 10 | 2 | 56496 | 9.95 | 16571 | 16680 | 4003.5 |
| A | -1 | -1 | -1 | -1.0 | 16571 | 16680 | 4003.5 |
| B | 8 | 3 | 8681621 | 2151.86 | 17168 | 17248 | 4026.5 |
| B | 0 | 187 | 930887 | 226.91 | 17168 | 17248 | 4026.5 |
| B | 0 | 234 | 136914 | 29.72 | 17168 | 17248 | 4026.5 |
| C | 15 | 246 | 142658 | 28.87 | 15645 | 16194 | 4380.5 |
| C | 9 | 236 | 62992 | 10.68 | 15645 | 16194 | 4380.5 |
| C | 12 | 4 | 47479 | 7.14 | 15645 | 16194 | 4380.5 |
| D | 7 | 85 | 719107 | 149.12 | 15158 | 15734 | 4716.9 |
| D | 13 | 105 | 702265 | 145.55 | 15158 | 15734 | 4716.9 |
| D | 13 | 53 | 541671 | 111.5 | 15158 | 15734 | 4716.9 |
Histogram calculated using DETX and DETY for each event in the final _common_clean file
| Quadrant A | 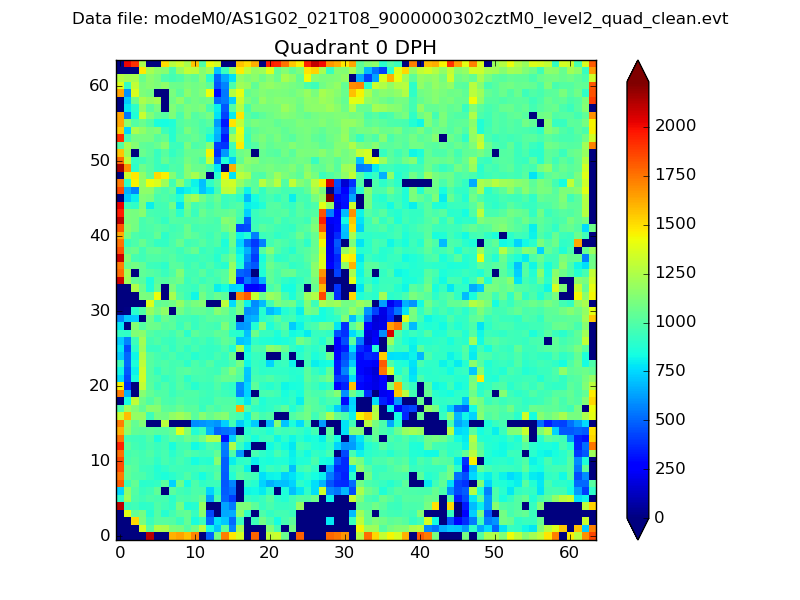 |
 |
Quadrant B |
|---|---|---|---|
| Quadrant D | 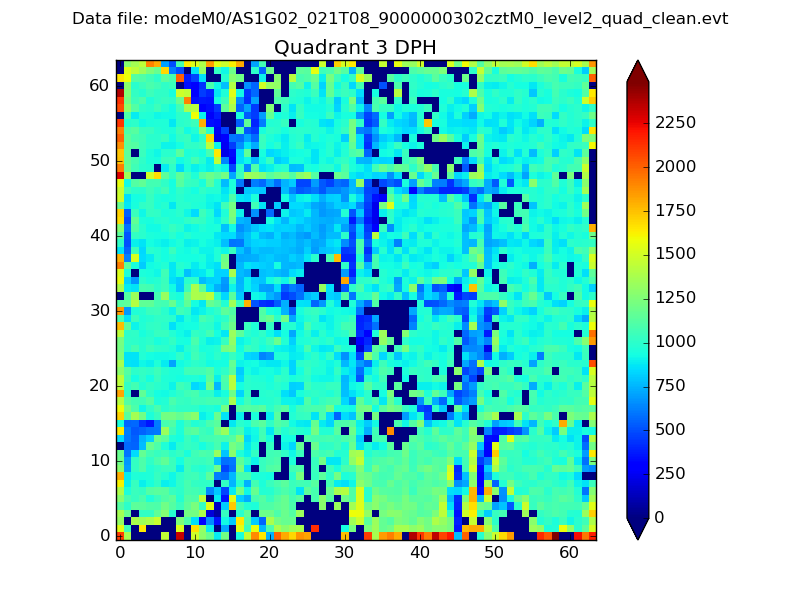 |
 |
Quadrant C |
| Plot type | Count rate plots | Images |
|---|---|---|
| Comparison with Poisson distribution Blue bars denote a histogram of data divided into 1 sec bins. Red curve is a Poisson curve with rate = median count rate of data. |
 |
 |
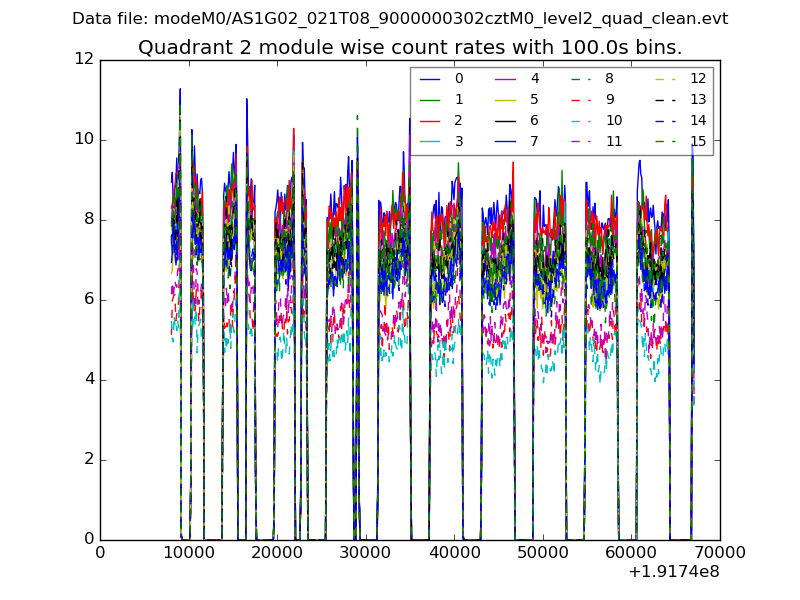
| Quadrant-wise count rates Data is divided into 100 sec bins |
 |
|
| Module-wise count rates for Quadrant A Data is divided into 100 sec bins |
 |
 |
| Module-wise count rates for Quadrant B Data is divided into 100 sec bins |
 |
 |
| Module-wise count rates for Quadrant C Data is divided into 100 sec bins |
 |
 |
| Module-wise count rates for Quadrant D Data is divided into 100 sec bins |
 |
 |
| Parameter | Plot |
|---|---|
| CZT HV Monitor |  |
| D_VDD |  |
| Temperature 1 |  |
| Veto HV Monitor |  |
| Veto LLD | 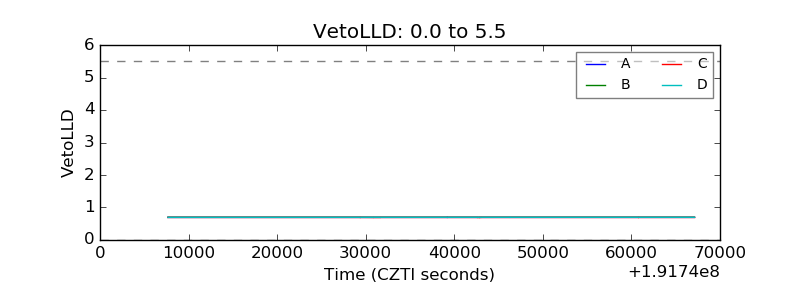 |
| Alpha Counter |  |
| _CPM_Rate |  |
| CZT Counter |  |
| +2.5 Volts monitor |  |
| +5 Volts monitor |  |
| _ROLL_ROT |  |
| _Roll_DEC |  |
| _Roll_RA |  |
| Veto Counter |  |