| Param | Original file | Final file |
|---|---|---|
| Filename | modeM0/AS1G02_021T11_9000000300cztM0_level2.evt | modeM0/AS1G02_021T11_9000000300cztM0_level2_quad_clean.evt |
| Size (bytes) | 3,202,274,880 | 283,492,800 |
| Size | 3.0 GB | 270.4 MB |
| Events in quadrant A | 25,203,220 | 1,779,459 |
| Events in quadrant B | 24,831,109 | 1,835,050 |
| Events in quadrant C | 22,871,225 | 1,813,329 |
| Events in quadrant D | 22,721,596 | 1,746,440 |
| Mode M0 | |||
|---|---|---|---|
| Quadrant | BADHDUFLAG | Total packets | Discarded packets |
| A | 0 | 89482 | 0 |
| B | 0 | 88344 | 0 |
| C | 0 | 82611 | 0 |
| D | 0 | 82210 | 0 |
| Mode M9 | |||
|---|---|---|---|
| Quadrant | BADHDUFLAG | Total packets | Discarded packets |
| A | 0 | 4 | 0 |
| B | 1 | 4 | 0 |
| C | 1 | 4 | 0 |
| D | 1 | 1 | 0 |
| Mode SS | |||
|---|---|---|---|
| Quadrant | BADHDUFLAG | Total packets | Discarded packets |
| A | 0 | 412 | 0 |
| B | 0 | 412 | 0 |
| C | 0 | 412 | 0 |
| D | 0 | 412 | 0 |
| Quadrant | Total seconds | Saturated seconds | Saturation percentage |
|---|---|---|---|
| A | 20505 | 112 | 0.546208% |
| B | 20507 | 112 | 0.546155% |
| C | 20508 | 63 | 0.307197% |
| D | 20510 | 216 | 1.053145% |
Noise dominated data is calculated using 1-second bins in cleaned event files. If a bin has >2000 counts, and if more than 50% of those come from <1% of pixels, then it is considered to be noise-dominated and hence unusable.
| Quadrant | # 1 sec bins | Bins with >0 counts | Bins with >2000 counts | High rate bins dominated by noise | Noise dominated (total time) | Noise dominated (detector-on time) | Marked lightcurve |
|---|---|---|---|---|---|---|---|
| A | 25274 | 20516 | 966 | 966 | 3.82% | 4.71% | 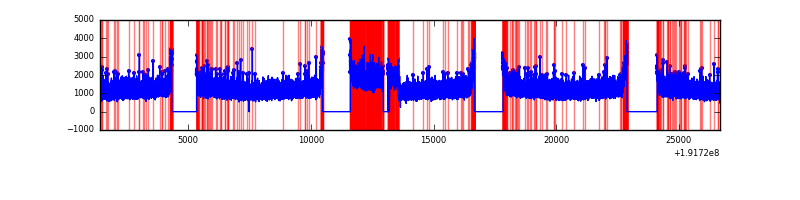 |
| B | 25274 | 20518 | 670 | 670 | 2.65% | 3.27% |  |
| C | 25274 | 20518 | 513 | 513 | 2.03% | 2.50% |  |
| D | 25274 | 20519 | 812 | 812 | 3.21% | 3.96% |  |
Top three noisy pixels from each quadrant. If the there are fewer than three noisy pixels in the level2.evt file, extra rows are filled as -1
| Pixel properties | Quadrant properties | ||||||
|---|---|---|---|---|---|---|---|
| Quadrant | DetID | PixID | Counts | Sigma | Mean | Median | Sigma |
| A | 15 | 236 | 1044652 | 687.22 | 6318 | 6367 | 1510.8 |
| A | 10 | 2 | 16914 | 6.98 | 6318 | 6367 | 1510.8 |
| A | -1 | -1 | -1 | -1.0 | 6318 | 6367 | 1510.8 |
| B | 0 | 220 | 42735 | 23.67 | 6544 | 6595 | 1527.1 |
| B | 0 | 228 | 16836 | 6.71 | 6544 | 6595 | 1527.1 |
| B | 11 | 111 | 14307 | 5.05 | 6544 | 6595 | 1527.1 |
| C | 10 | 34 | 30336 | 15.05 | 5848 | 6056 | 1612.8 |
| C | 7 | 159 | 28594 | 13.97 | 5848 | 6056 | 1612.8 |
| C | -1 | -1 | -1 | -1.0 | 5848 | 6056 | 1612.8 |
| D | 1 | 83 | 755985 | 424.86 | 5723 | 5943 | 1765.4 |
| D | 7 | 34 | 470429 | 263.1 | 5723 | 5943 | 1765.4 |
| D | 14 | 3 | 55616 | 28.14 | 5723 | 5943 | 1765.4 |
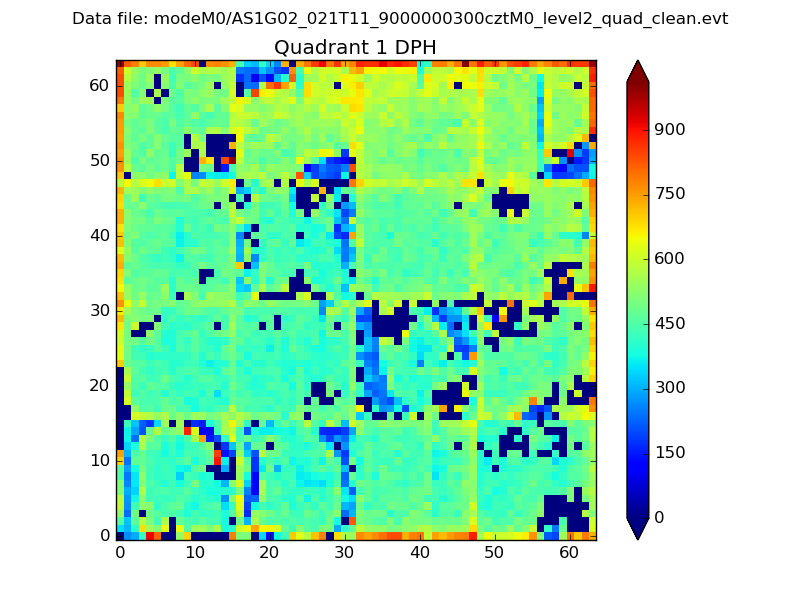
Histogram calculated using DETX and DETY for each event in the final _common_clean file
| Quadrant A |  |
 |
Quadrant B |
|---|---|---|---|
| Quadrant D |  |
 |
Quadrant C |
| Plot type | Count rate plots | Images |
|---|---|---|
| Comparison with Poisson distribution Blue bars denote a histogram of data divided into 1 sec bins. Red curve is a Poisson curve with rate = median count rate of data. |
 |
 |
| Quadrant-wise count rates Data is divided into 100 sec bins |
 |
|
| Module-wise count rates for Quadrant A Data is divided into 100 sec bins |
 |
 |
| Module-wise count rates for Quadrant B Data is divided into 100 sec bins |
 |
 |
| Module-wise count rates for Quadrant C Data is divided into 100 sec bins |
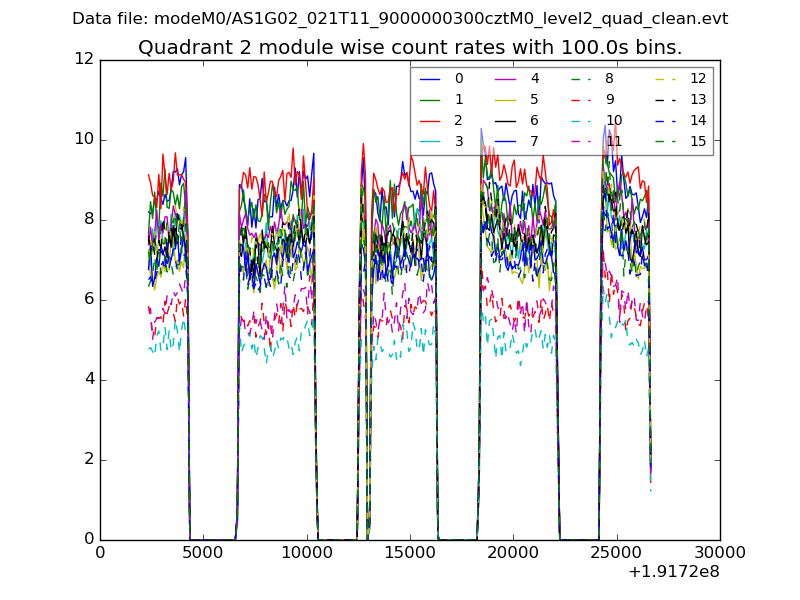 |
 |
| Module-wise count rates for Quadrant D Data is divided into 100 sec bins |
 |
 |
| Parameter | Plot |
|---|---|
| CZT HV Monitor |  |
| D_VDD |  |
| Temperature 1 | 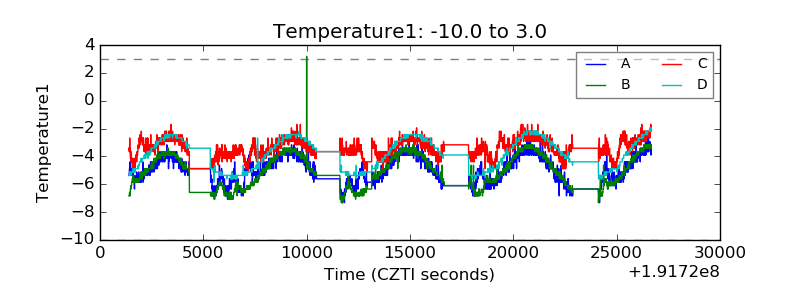 |
| Veto HV Monitor |  |
| Veto LLD |  |
| Alpha Counter |  |
| _CPM_Rate | 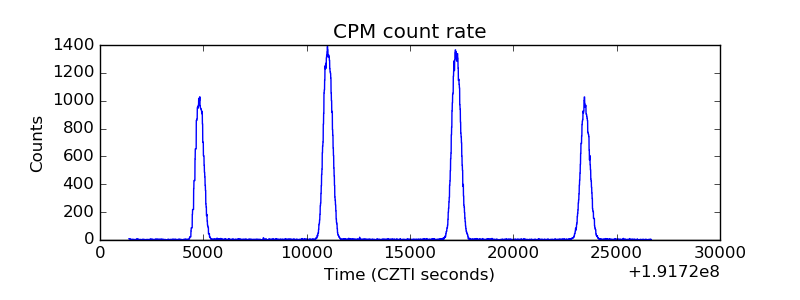 |
| CZT Counter | 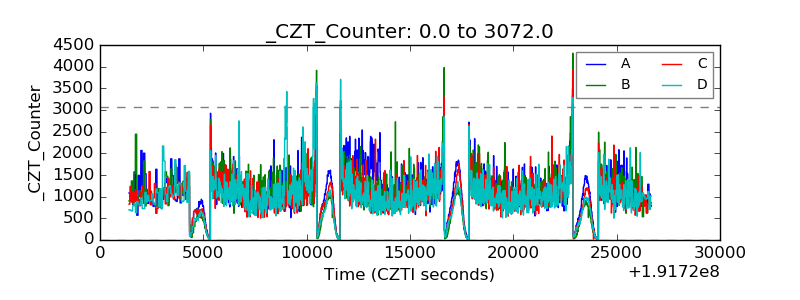 |
| +2.5 Volts monitor | 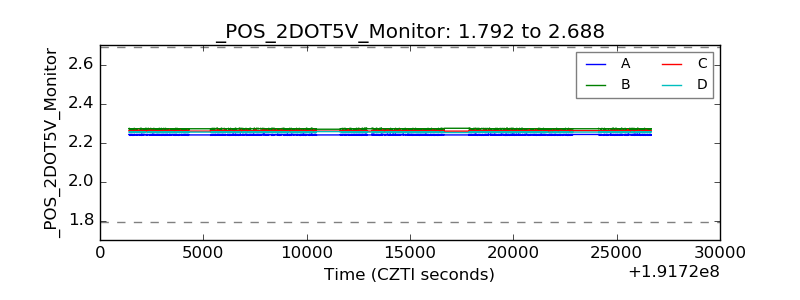 |
| +5 Volts monitor |  |
| _ROLL_ROT |  |
| _Roll_DEC |  |
| _Roll_RA |  |
| Veto Counter |  |