| Param | Original file | Final file |
|---|---|---|
| Filename | modeM0/AS1G02_025T01_9000000298cztM0_level2.evt | modeM0/AS1G02_025T01_9000000298cztM0_level2_quad_clean.evt |
| Size (bytes) | 16,412,137,920 | 1,231,427,520 |
| Size | 15.3 GB | 1.1 GB |
| Events in quadrant A | 123,701,241 | 7,740,949 |
| Events in quadrant B | 125,135,415 | 7,905,828 |
| Events in quadrant C | 117,378,751 | 7,549,449 |
| Events in quadrant D | 124,216,789 | 7,212,132 |
| Mode SS | |||
|---|---|---|---|
| Quadrant | BADHDUFLAG | Total packets | Discarded packets |
| A | 0 | 2012 | 0 |
| B | 0 | 2012 | 0 |
| C | 0 | 2012 | 0 |
| D | 0 | 2012 | 0 |
| Mode M0 | |||
|---|---|---|---|
| Quadrant | BADHDUFLAG | Total packets | Discarded packets |
| A | 0 | 438857 | 0 |
| B | 0 | 442987 | 0 |
| C | 0 | 420161 | 0 |
| D | 0 | 441035 | 0 |
| Mode M9 | |||
|---|---|---|---|
| Quadrant | BADHDUFLAG | Total packets | Discarded packets |
| A | 0 | 18 | 0 |
| B | 1 | 18 | 0 |
| C | 1 | 18 | 0 |
| D | 1 | 1 | 0 |
| Quadrant | Total seconds | Saturated seconds | Saturation percentage |
|---|---|---|---|
| A | 100555 | 595 | 0.591716% |
| B | 100557 | 498 | 0.495242% |
| C | 100559 | 353 | 0.351038% |
| D | 100559 | 2383 | 2.369753% |
Noise dominated data is calculated using 1-second bins in cleaned event files. If a bin has >2000 counts, and if more than 50% of those come from <1% of pixels, then it is considered to be noise-dominated and hence unusable.
| Quadrant | # 1 sec bins | Bins with >0 counts | Bins with >2000 counts | High rate bins dominated by noise | Noise dominated (total time) | Noise dominated (detector-on time) | Marked lightcurve |
|---|---|---|---|---|---|---|---|
| A | 113885 | 100576 | 4154 | 4154 | 3.65% | 4.13% | 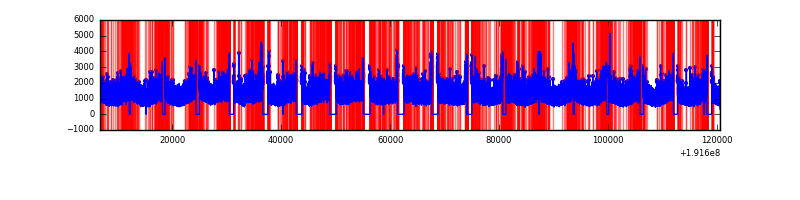 |
| B | 113885 | 100577 | 4118 | 4118 | 3.62% | 4.09% |  |
| C | 113885 | 100582 | 3092 | 3092 | 2.72% | 3.07% | 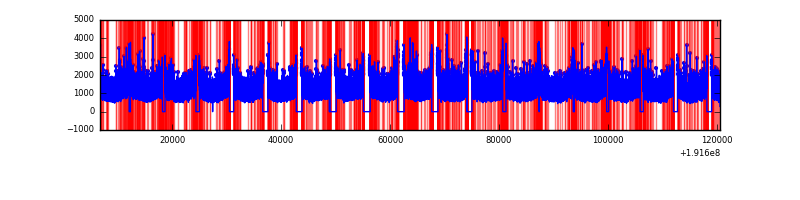 |
| D | 113885 | 100579 | 6945 | 6945 | 6.10% | 6.91% |  |
Top three noisy pixels from each quadrant. If the there are fewer than three noisy pixels in the level2.evt file, extra rows are filled as -1
| Pixel properties | Quadrant properties | ||||||
|---|---|---|---|---|---|---|---|
| Quadrant | DetID | PixID | Counts | Sigma | Mean | Median | Sigma |
| A | 0 | 231 | 2850620 | 372.34 | 31455 | 31643 | 7571.0 |
| A | 15 | 236 | 195241 | 21.61 | 31455 | 31643 | 7571.0 |
| A | 14 | 5 | 152312 | 15.94 | 31455 | 31643 | 7571.0 |
| B | 0 | 234 | 374850 | 44.57 | 32760 | 32904 | 7672.0 |
| B | 0 | 220 | 368872 | 43.79 | 32760 | 32904 | 7672.0 |
| B | 4 | 200 | 122342 | 11.66 | 32760 | 32904 | 7672.0 |
| C | 8 | 208 | 1393434 | 164.73 | 29635 | 30685 | 8272.7 |
| C | 14 | 223 | 186469 | 18.83 | 29635 | 30685 | 8272.7 |
| C | 9 | 236 | 132254 | 12.28 | 29635 | 30685 | 8272.7 |
| D | 7 | 85 | 3853737 | 431.73 | 28637 | 29729 | 8857.3 |
| D | 1 | 83 | 3061333 | 342.27 | 28637 | 29729 | 8857.3 |
| D | 10 | 181 | 2505160 | 279.48 | 28637 | 29729 | 8857.3 |
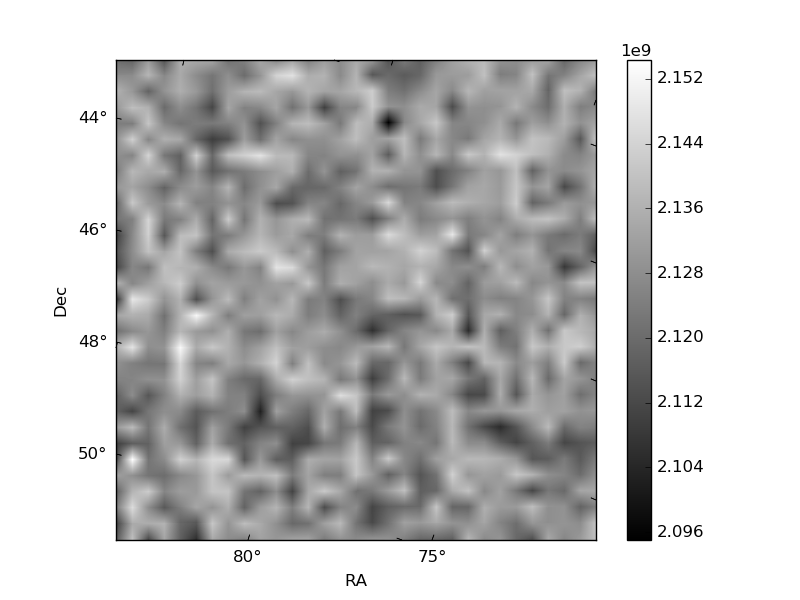
Histogram calculated using DETX and DETY for each event in the final _common_clean file
| Quadrant A |  |
 |
Quadrant B |
|---|---|---|---|
| Quadrant D |  |
 |
Quadrant C |
| Plot type | Count rate plots | Images |
|---|---|---|
| Comparison with Poisson distribution Blue bars denote a histogram of data divided into 1 sec bins. Red curve is a Poisson curve with rate = median count rate of data. |
 |
 |
| Quadrant-wise count rates Data is divided into 100 sec bins |
 |
|
| Module-wise count rates for Quadrant A Data is divided into 100 sec bins |
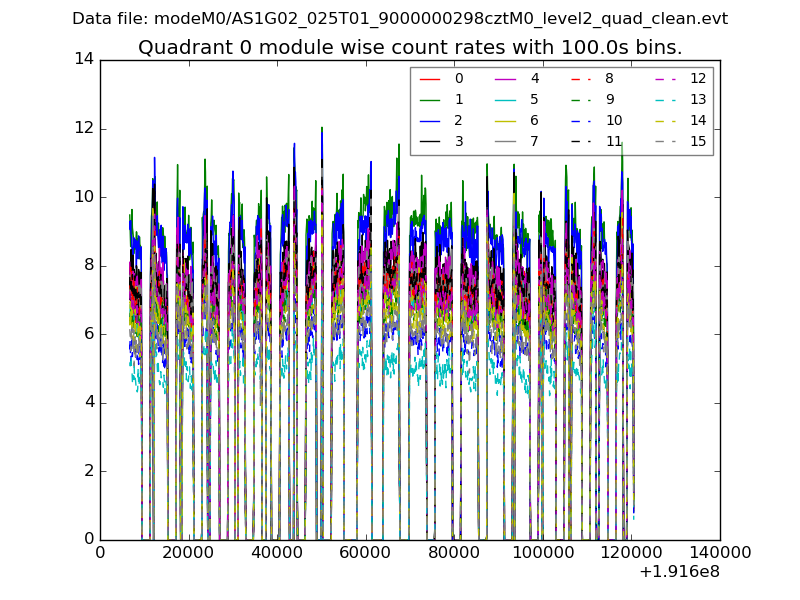 |
 |
| Module-wise count rates for Quadrant B Data is divided into 100 sec bins |
 |
 |
| Module-wise count rates for Quadrant C Data is divided into 100 sec bins |
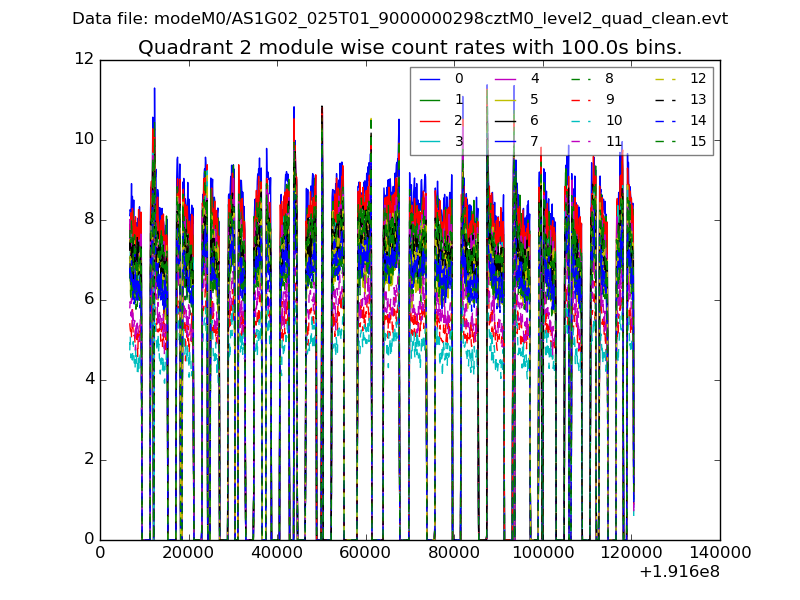 |
 |
| Module-wise count rates for Quadrant D Data is divided into 100 sec bins |
 |
 |
| Parameter | Plot |
|---|---|
| CZT HV Monitor |  |
| D_VDD |  |
| Temperature 1 |  |
| Veto HV Monitor | 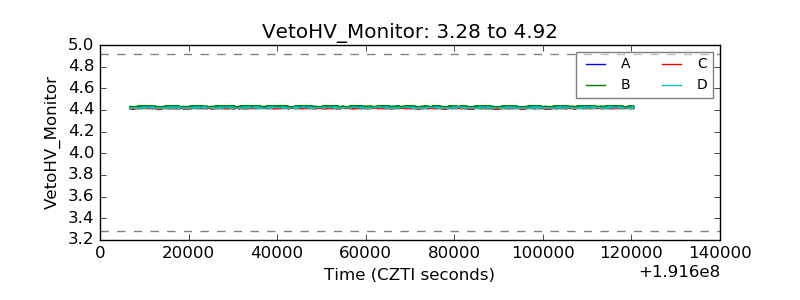 |
| Veto LLD |  |
| Alpha Counter |  |
| _CPM_Rate |  |
| CZT Counter |  |
| +2.5 Volts monitor | 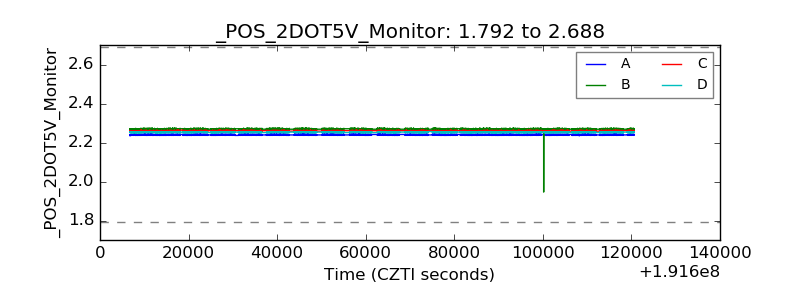 |
| +5 Volts monitor |  |
| _ROLL_ROT |  |
| _Roll_DEC |  |
| _Roll_RA |  |
| Veto Counter |  |