| Param | Original file | Final file |
|---|---|---|
| Filename | modeM0/AS1G02_020T02_9000000294cztM0_level2.evt | modeM0/AS1G02_020T02_9000000294cztM0_level2_quad_clean.evt |
| Size (bytes) | 2,608,937,280 | 236,064,960 |
| Size | 2.4 GB | 225.1 MB |
| Events in quadrant A | 20,029,807 | 1,508,464 |
| Events in quadrant B | 19,837,721 | 1,550,195 |
| Events in quadrant C | 19,157,521 | 1,506,145 |
| Events in quadrant D | 18,900,772 | 1,450,950 |
| Mode M9 | |||
|---|---|---|---|
| Quadrant | BADHDUFLAG | Total packets | Discarded packets |
| A | 0 | 2 | 0 |
| B | 1 | 2 | 0 |
| C | 1 | 2 | 0 |
| D | 1 | 1 | 0 |
| Mode M0 | |||
|---|---|---|---|
| Quadrant | BADHDUFLAG | Total packets | Discarded packets |
| A | 0 | 71146 | 0 |
| B | 0 | 70556 | 0 |
| C | 0 | 68604 | 0 |
| D | 0 | 67896 | 0 |
| Mode SS | |||
|---|---|---|---|
| Quadrant | BADHDUFLAG | Total packets | Discarded packets |
| A | 0 | 332 | 0 |
| B | 0 | 332 | 0 |
| C | 0 | 332 | 0 |
| D | 0 | 332 | 0 |
| Quadrant | Total seconds | Saturated seconds | Saturation percentage |
|---|---|---|---|
| A | 16446 | 6 | 0.036483% |
| B | 16442 | 12 | 0.072984% |
| C | 16444 | 23 | 0.139869% |
| D | 16446 | 37 | 0.224979% |
Noise dominated data is calculated using 1-second bins in cleaned event files. If a bin has >2000 counts, and if more than 50% of those come from <1% of pixels, then it is considered to be noise-dominated and hence unusable.
| Quadrant | # 1 sec bins | Bins with >0 counts | Bins with >2000 counts | High rate bins dominated by noise | Noise dominated (total time) | Noise dominated (detector-on time) | Marked lightcurve |
|---|---|---|---|---|---|---|---|
| A | 19636 | 16449 | 380 | 380 | 1.94% | 2.31% |  |
| B | 19636 | 16447 | 330 | 330 | 1.68% | 2.01% |  |
| C | 19636 | 16448 | 278 | 278 | 1.42% | 1.69% |  |
| D | 19636 | 16449 | 289 | 289 | 1.47% | 1.76% | 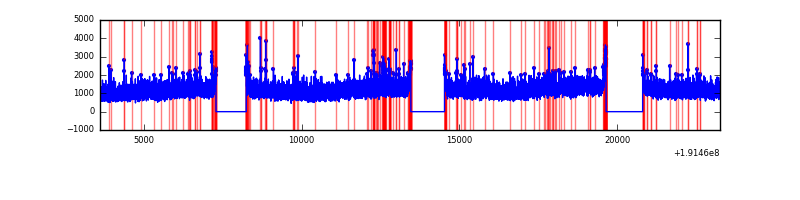 |
Top three noisy pixels from each quadrant. If the there are fewer than three noisy pixels in the level2.evt file, extra rows are filled as -1
| Pixel properties | Quadrant properties | ||||||
|---|---|---|---|---|---|---|---|
| Quadrant | DetID | PixID | Counts | Sigma | Mean | Median | Sigma |
| A | 0 | 231 | 761033 | 628.61 | 5037 | 5054 | 1202.6 |
| A | 15 | 22 | 13945 | 7.39 | 5037 | 5054 | 1202.6 |
| A | 10 | 2 | 12782 | 6.43 | 5037 | 5054 | 1202.6 |
| B | 0 | 234 | 37372 | 26.37 | 5214 | 5241 | 1218.6 |
| B | 15 | 85 | 26463 | 17.41 | 5214 | 5241 | 1218.6 |
| B | 7 | 202 | 21140 | 13.05 | 5214 | 5241 | 1218.6 |
| C | 8 | 208 | 171071 | 123.54 | 4855 | 5043 | 1343.9 |
| C | 9 | 236 | 33291 | 21.02 | 4855 | 5043 | 1343.9 |
| C | 12 | 4 | 14972 | 7.39 | 4855 | 5043 | 1343.9 |
| D | 7 | 85 | 856298 | 586.86 | 4721 | 4911 | 1450.8 |
| D | 2 | 16 | 104812 | 68.86 | 4721 | 4911 | 1450.8 |
| D | 10 | 102 | 80528 | 52.12 | 4721 | 4911 | 1450.8 |
Histogram calculated using DETX and DETY for each event in the final _common_clean file
| Quadrant A | 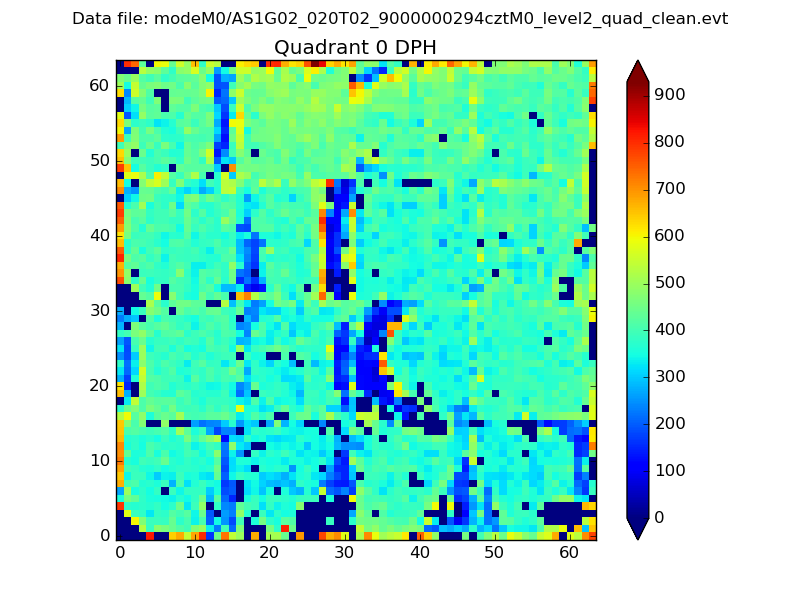 |
 |
Quadrant B |
|---|---|---|---|
| Quadrant D |  |
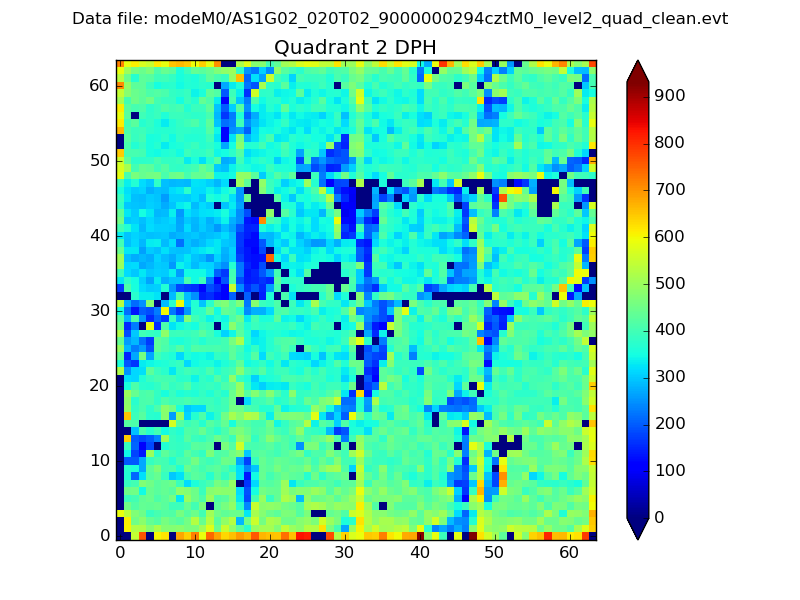 |
Quadrant C |
| Plot type | Count rate plots | Images |
|---|---|---|
| Comparison with Poisson distribution Blue bars denote a histogram of data divided into 1 sec bins. Red curve is a Poisson curve with rate = median count rate of data. |
 |
 |
| Quadrant-wise count rates Data is divided into 100 sec bins |
 |
|
| Module-wise count rates for Quadrant A Data is divided into 100 sec bins |
 |
 |
| Module-wise count rates for Quadrant B Data is divided into 100 sec bins |
 |
 |
| Module-wise count rates for Quadrant C Data is divided into 100 sec bins |
 |
 |
| Module-wise count rates for Quadrant D Data is divided into 100 sec bins |
 |
 |
| Parameter | Plot |
|---|---|
| CZT HV Monitor |  |
| D_VDD | 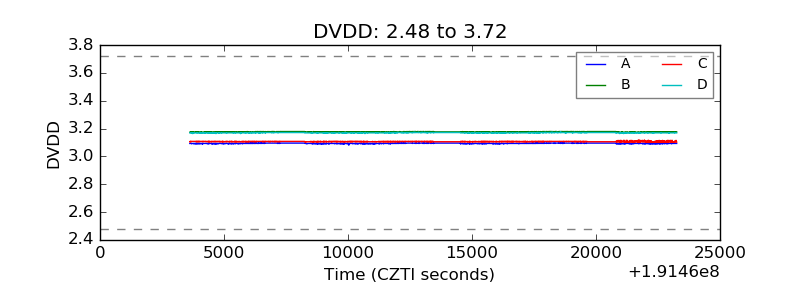 |
| Temperature 1 |  |
| Veto HV Monitor |  |
| Veto LLD |  |
| Alpha Counter |  |
| _CPM_Rate |  |
| CZT Counter |  |
| +2.5 Volts monitor |  |
| +5 Volts monitor | 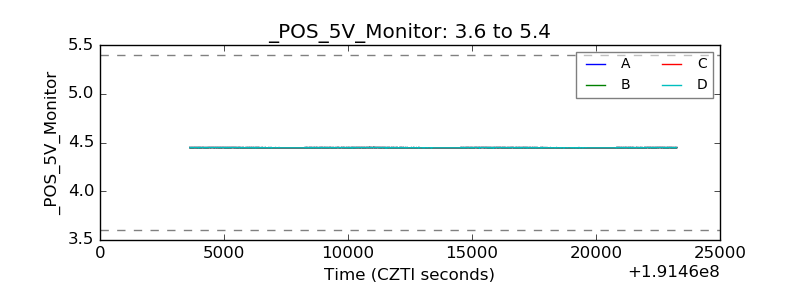 |
| _ROLL_ROT | 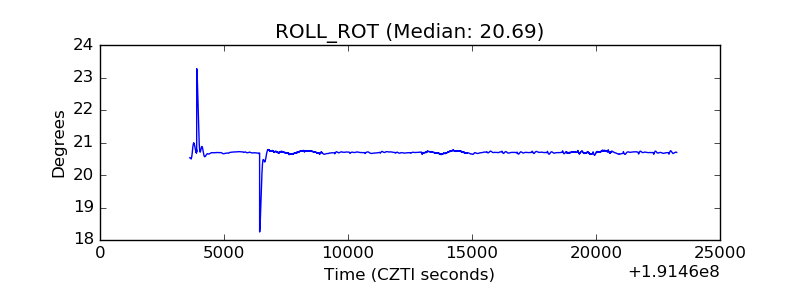 |
| _Roll_DEC |  |
| _Roll_RA | 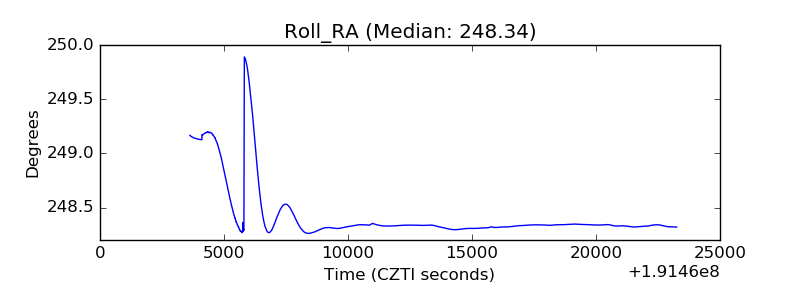 |
| Veto Counter |  |