| Param | Original file | Final file |
|---|---|---|
| Filename | modeM0/AS1G02_020T01_9000000296cztM0_level2.evt | modeM0/AS1G02_020T01_9000000296cztM0_level2_quad_clean.evt |
| Size (bytes) | 17,220,188,160 | 1,442,499,840 |
| Size | 16.0 GB | 1.3 GB |
| Events in quadrant A | 130,831,520 | 9,232,819 |
| Events in quadrant B | 130,590,221 | 9,348,117 |
| Events in quadrant C | 125,053,431 | 9,074,968 |
| Events in quadrant D | 128,146,393 | 8,851,285 |
| Mode M0 | |||
|---|---|---|---|
| Quadrant | BADHDUFLAG | Total packets | Discarded packets |
| A | 0 | 463207 | 0 |
| B | 0 | 462472 | 0 |
| C | 0 | 445819 | 0 |
| D | 0 | 455383 | 0 |
| Mode SS | |||
|---|---|---|---|
| Quadrant | BADHDUFLAG | Total packets | Discarded packets |
| A | 0 | 2096 | 0 |
| B | 0 | 2096 | 0 |
| C | 0 | 2096 | 0 |
| D | 0 | 2096 | 0 |
| Mode M9 | |||
|---|---|---|---|
| Quadrant | BADHDUFLAG | Total packets | Discarded packets |
| A | 0 | 19 | 0 |
| B | 1 | 19 | 0 |
| C | 1 | 19 | 0 |
| D | 1 | 1 | 0 |
| Quadrant | Total seconds | Saturated seconds | Saturation percentage |
|---|---|---|---|
| A | 104888 | 639 | 0.609221% |
| B | 104894 | 551 | 0.525292% |
| C | 104894 | 525 | 0.500505% |
| D | 104894 | 1932 | 1.841859% |
Noise dominated data is calculated using 1-second bins in cleaned event files. If a bin has >2000 counts, and if more than 50% of those come from <1% of pixels, then it is considered to be noise-dominated and hence unusable.
| Quadrant | # 1 sec bins | Bins with >0 counts | Bins with >2000 counts | High rate bins dominated by noise | Noise dominated (total time) | Noise dominated (detector-on time) | Marked lightcurve |
|---|---|---|---|---|---|---|---|
| A | 121327 | 104915 | 4552 | 4552 | 3.75% | 4.34% | 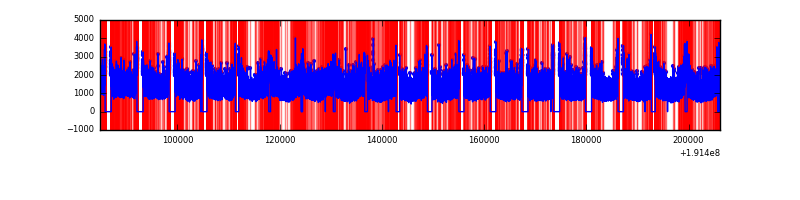 |
| B | 121327 | 104917 | 4538 | 4538 | 3.74% | 4.33% |  |
| C | 121327 | 104921 | 4171 | 4171 | 3.44% | 3.98% |  |
| D | 121327 | 104919 | 6253 | 6253 | 5.15% | 5.96% |  |
Top three noisy pixels from each quadrant. If the there are fewer than three noisy pixels in the level2.evt file, extra rows are filled as -1
| Pixel properties | Quadrant properties | ||||||
|---|---|---|---|---|---|---|---|
| Quadrant | DetID | PixID | Counts | Sigma | Mean | Median | Sigma |
| A | 0 | 231 | 4216139 | 528.4 | 33049 | 33240 | 7916.2 |
| A | 15 | 236 | 137261 | 13.14 | 33049 | 33240 | 7916.2 |
| A | 10 | 2 | 126352 | 11.76 | 33049 | 33240 | 7916.2 |
| B | 0 | 220 | 217855 | 22.68 | 34279 | 34408 | 8086.9 |
| B | 4 | 216 | 190884 | 19.35 | 34279 | 34408 | 8086.9 |
| B | 0 | 234 | 165877 | 16.26 | 34279 | 34408 | 8086.9 |
| C | 8 | 208 | 3198777 | 366.62 | 31057 | 32120 | 8637.4 |
| C | 10 | 82 | 359243 | 37.87 | 31057 | 32120 | 8637.4 |
| C | 9 | 236 | 182999 | 17.47 | 31057 | 32120 | 8637.4 |
| D | 7 | 85 | 4811325 | 512.23 | 30247 | 31384 | 9331.7 |
| D | 13 | 169 | 1822495 | 191.94 | 30247 | 31384 | 9331.7 |
| D | 2 | 16 | 1784686 | 187.89 | 30247 | 31384 | 9331.7 |
Histogram calculated using DETX and DETY for each event in the final _common_clean file
| Quadrant A |  |
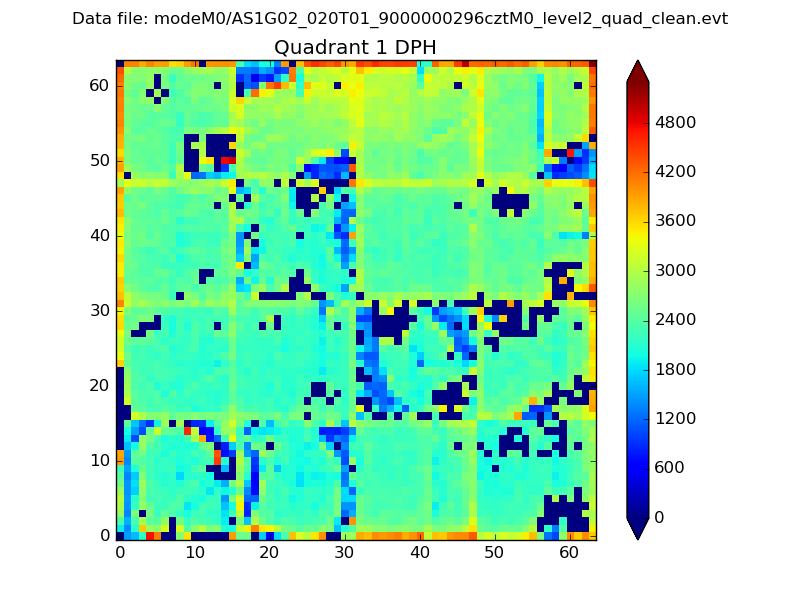 |
Quadrant B |
|---|---|---|---|
| Quadrant D |  |
 |
Quadrant C |
| Plot type | Count rate plots | Images |
|---|---|---|
| Comparison with Poisson distribution Blue bars denote a histogram of data divided into 1 sec bins. Red curve is a Poisson curve with rate = median count rate of data. |
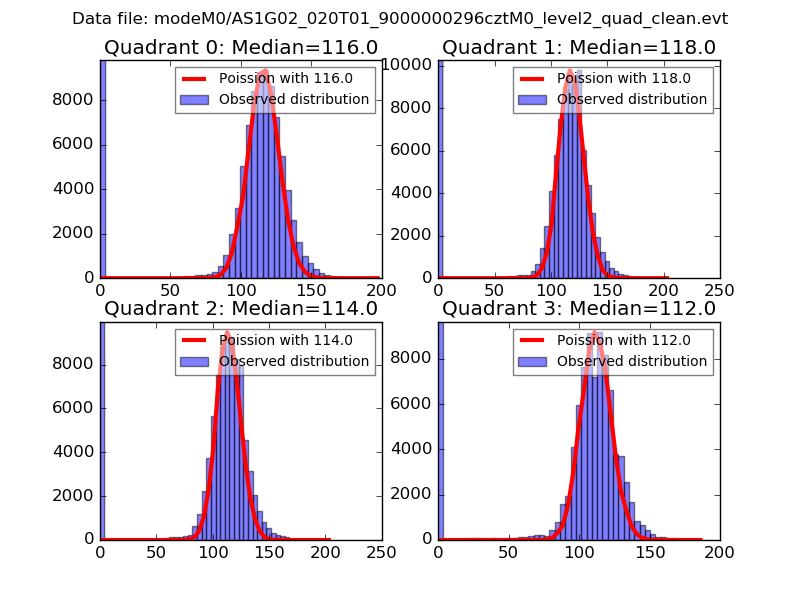 |
 |
| Quadrant-wise count rates Data is divided into 100 sec bins |
 |
|
| Module-wise count rates for Quadrant A Data is divided into 100 sec bins |
 |
 |
| Module-wise count rates for Quadrant B Data is divided into 100 sec bins |
 |
 |
| Module-wise count rates for Quadrant C Data is divided into 100 sec bins |
 |
 |
| Module-wise count rates for Quadrant D Data is divided into 100 sec bins |
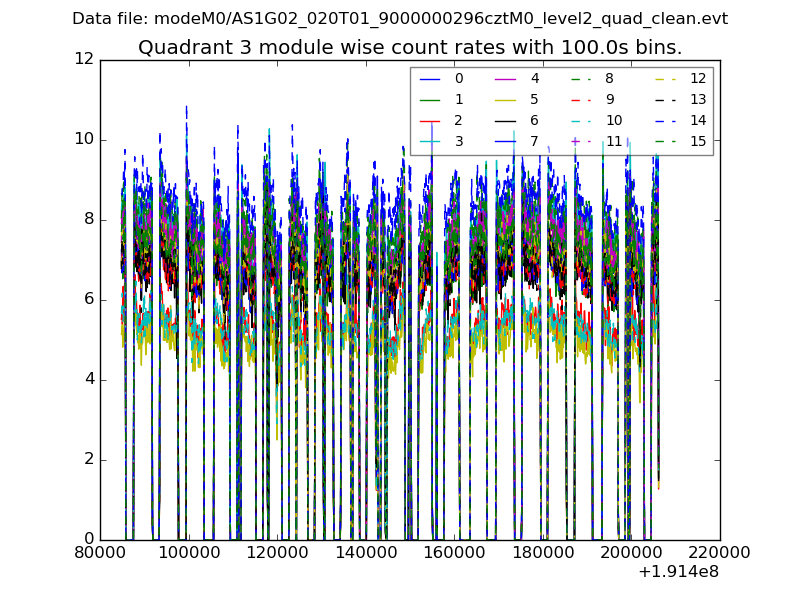 |
 |
| Parameter | Plot |
|---|---|
| CZT HV Monitor |  |
| D_VDD | 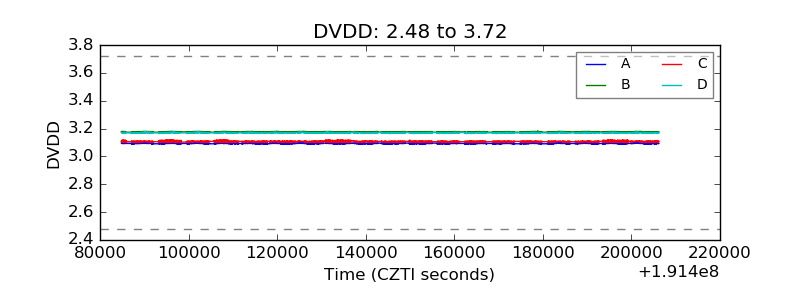 |
| Temperature 1 |  |
| Veto HV Monitor |  |
| Veto LLD |  |
| Alpha Counter |  |
| _CPM_Rate |  |
| CZT Counter | 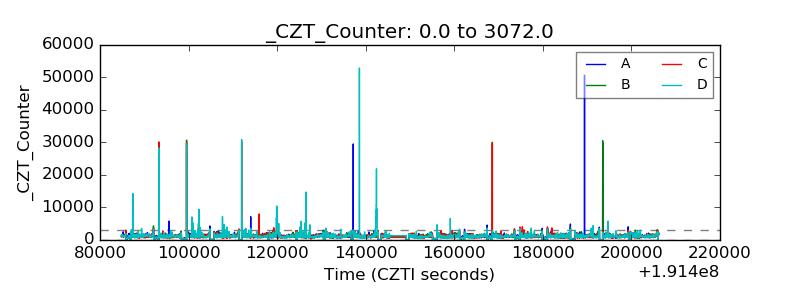 |
| +2.5 Volts monitor |  |
| +5 Volts monitor |  |
| _ROLL_ROT | 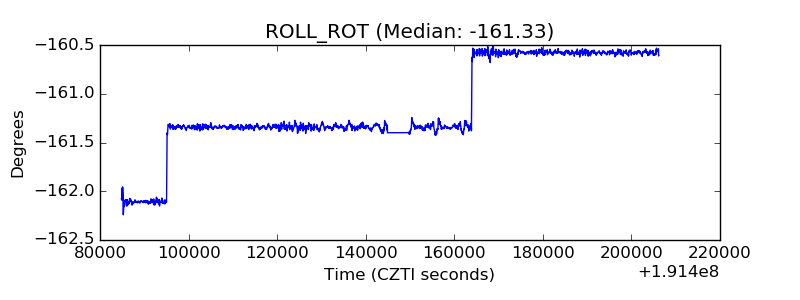 |
| _Roll_DEC | 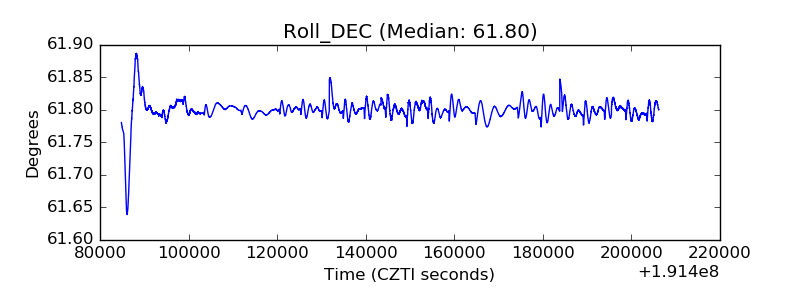 |
| _Roll_RA | 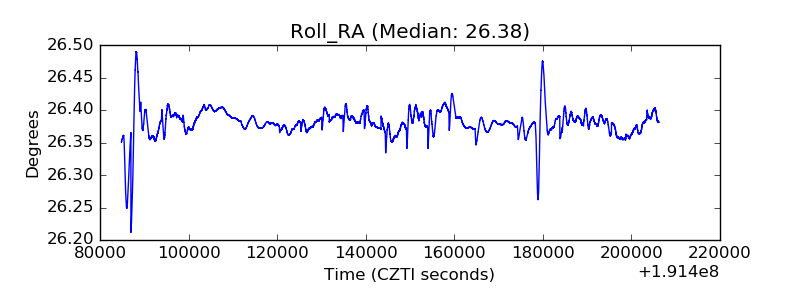 |
| Veto Counter |  |