| Param | Original file | Final file |
|---|---|---|
| Filename | modeM0/AS1T01_051T01_9000000292cztM0_level2_bc.evt | modeM0/AS1T01_051T01_9000000292cztM0_level2_quad_clean.evt |
| Size (bytes) | 2,233,981,440 | 1,068,765,120 |
| Size | 2.1 GB | 1019.3 MB |
| Events in quadrant A | 12,314,717 | 7,038,350 |
| Events in quadrant B | 12,723,974 | 7,052,893 |
| Events in quadrant C | 13,459,302 | 6,862,342 |
| Events in quadrant D | 24,402,278 | 6,638,100 |
| Mode SS | |||
|---|---|---|---|
| Quadrant | BADHDUFLAG | Total packets | Discarded packets |
| A | 0 | 1398 | 0 |
| B | 0 | 1398 | 0 |
| C | 0 | 1398 | 0 |
| D | 0 | 1398 | 0 |
| Mode M9 | |||
|---|---|---|---|
| Quadrant | BADHDUFLAG | Total packets | Discarded packets |
| A | 0 | 15 | 0 |
| B | 1 | 15 | 0 |
| C | 1 | 15 | 0 |
| D | 1 | 1 | 0 |
| Mode M0 | |||
|---|---|---|---|
| Quadrant | BADHDUFLAG | Total packets | Discarded packets |
| A | 0 | 297312 | 0 |
| B | 0 | 304843 | 0 |
| C | 0 | 291701 | 0 |
| D | 0 | 317608 | 0 |
| Quadrant | Total seconds | Saturated seconds | Saturation percentage |
|---|---|---|---|
| A | 69759 | 155 | 0.222194% |
| B | 69753 | 153 | 0.219345% |
| C | 69755 | 206 | 0.295319% |
| D | 69759 | 2228 | 3.193853% |
Noise dominated data is calculated using 1-second bins in cleaned event files. If a bin has >2000 counts, and if more than 50% of those come from <1% of pixels, then it is considered to be noise-dominated and hence unusable.
| Quadrant | # 1 sec bins | Bins with >0 counts | Bins with >2000 counts | High rate bins dominated by noise | Noise dominated (total time) | Noise dominated (detector-on time) | Marked lightcurve |
|---|---|---|---|---|---|---|---|
| A | 80176 | 69760 | 0 | 0 | 0.00% | 0.00% |  |
| B | 80176 | 69756 | 2 | 2 | 0.00% | 0.00% |  |
| C | 80176 | 69760 | 30 | 30 | 0.04% | 0.04% | 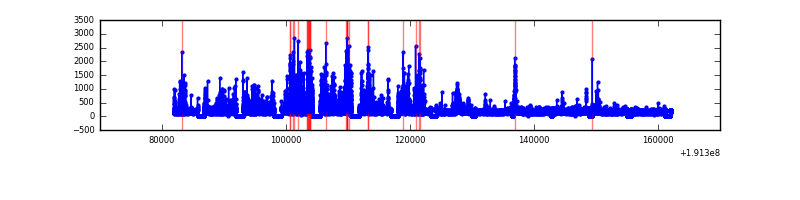 |
| D | 80176 | 69760 | 956 | 956 | 1.19% | 1.37% |  |
Top three noisy pixels from each quadrant. If the there are fewer than three noisy pixels in the level2.evt file, extra rows are filled as -1
| Pixel properties | Quadrant properties | ||||||
|---|---|---|---|---|---|---|---|
| Quadrant | DetID | PixID | Counts | Sigma | Mean | Median | Sigma |
| A | 0 | 231 | 191479 | 289.15 | 3119 | 3055 | 651.6 |
| A | 10 | 2 | 77404 | 114.1 | 3119 | 3055 | 651.6 |
| A | 15 | 175 | 39877 | 56.51 | 3119 | 3055 | 651.6 |
| B | 0 | 234 | 150769 | 261.9 | 3172 | 3077 | 563.9 |
| B | 0 | 244 | 99228 | 170.5 | 3172 | 3077 | 563.9 |
| B | 4 | 200 | 92228 | 158.09 | 3172 | 3077 | 563.9 |
| C | 8 | 208 | 1055841 | 1643.38 | 3029 | 2967 | 640.7 |
| C | 1 | 192 | 254116 | 392.01 | 3029 | 2967 | 640.7 |
| C | 2 | 53 | 184856 | 283.9 | 3029 | 2967 | 640.7 |
| D | 7 | 85 | 4530476 | 6980.6 | 3012 | 2919 | 648.6 |
| D | 10 | 172 | 3052481 | 4701.82 | 3012 | 2919 | 648.6 |
| D | 1 | 83 | 1012649 | 1556.8 | 3012 | 2919 | 648.6 |
Histogram calculated using DETX and DETY for each event in the final _common_clean file
| Quadrant A |  |
 |
Quadrant B |
|---|---|---|---|
| Quadrant D |  |
 |
Quadrant C |
| Plot type | Count rate plots | Images |
|---|---|---|
| Comparison with Poisson distribution Blue bars denote a histogram of data divided into 1 sec bins. Red curve is a Poisson curve with rate = median count rate of data. |
 |
 |
| Quadrant-wise count rates Data is divided into 100 sec bins |
 |
|
| Module-wise count rates for Quadrant A Data is divided into 100 sec bins |
 |
 |
| Module-wise count rates for Quadrant B Data is divided into 100 sec bins |
 |
 |
| Module-wise count rates for Quadrant C Data is divided into 100 sec bins |
 |
 |
| Module-wise count rates for Quadrant D Data is divided into 100 sec bins |
 |
 |
| Parameter | Plot |
|---|---|
| CZT HV Monitor |  |
| D_VDD |  |
| Temperature 1 |  |
| Veto HV Monitor |  |
| Veto LLD |  |
| Alpha Counter |  |
| _CPM_Rate |  |
| CZT Counter |  |
| +2.5 Volts monitor |  |
| +5 Volts monitor |  |
| _ROLL_ROT |  |
| _Roll_DEC |  |
| _Roll_RA |  |
| Veto Counter |  |