| Param | Original file | Final file |
|---|---|---|
| Filename | modeM0/AS1G02_048T01_9000000286cztM0_level2.evt | modeM0/AS1G02_048T01_9000000286cztM0_level2_quad_clean.evt |
| Size (bytes) | 9,054,239,040 | 613,497,600 |
| Size | 8.4 GB | 585.1 MB |
| Events in quadrant A | 69,335,154 | 3,679,477 |
| Events in quadrant B | 69,593,722 | 3,746,423 |
| Events in quadrant C | 65,231,392 | 3,716,991 |
| Events in quadrant D | 66,348,191 | 3,581,495 |
| Mode M9 | |||
|---|---|---|---|
| Quadrant | BADHDUFLAG | Total packets | Discarded packets |
| A | 0 | 13 | 0 |
| B | 0 | 6 | 0 |
| C | 0 | 6 | 0 |
| D | 0 | 13 | 0 |
| Mode M0 | |||
|---|---|---|---|
| Quadrant | BADHDUFLAG | Total packets | Discarded packets |
| A | 0 | 245754 | 0 |
| B | 0 | 246597 | 0 |
| C | 0 | 233768 | 0 |
| D | 0 | 237061 | 0 |
| Mode SS | |||
|---|---|---|---|
| Quadrant | BADHDUFLAG | Total packets | Discarded packets |
| A | 0 | 1128 | 0 |
| B | 0 | 1128 | 0 |
| C | 0 | 1128 | 0 |
| D | 0 | 1128 | 0 |
| Quadrant | Total seconds | Saturated seconds | Saturation percentage |
|---|---|---|---|
| A | 56240 | 198 | 0.352063% |
| B | 56234 | 174 | 0.309421% |
| C | 56238 | 195 | 0.346741% |
| D | 56240 | 431 | 0.766358% |
Noise dominated data is calculated using 1-second bins in cleaned event files. If a bin has >2000 counts, and if more than 50% of those come from <1% of pixels, then it is considered to be noise-dominated and hence unusable.
| Quadrant | # 1 sec bins | Bins with >0 counts | Bins with >2000 counts | High rate bins dominated by noise | Noise dominated (total time) | Noise dominated (detector-on time) | Marked lightcurve |
|---|---|---|---|---|---|---|---|
| A | 63478 | 56251 | 2153 | 2153 | 3.39% | 3.83% |  |
| B | 63478 | 56248 | 2053 | 2053 | 3.23% | 3.65% | 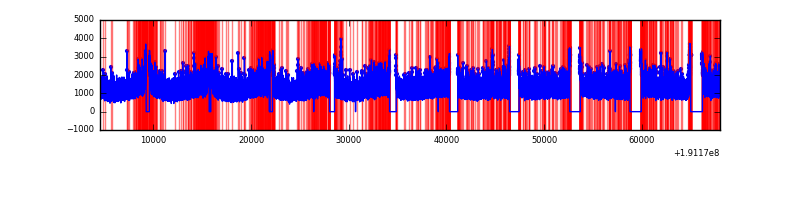 |
| C | 63478 | 56248 | 1474 | 1474 | 2.32% | 2.62% |  |
| D | 63478 | 56251 | 1987 | 1987 | 3.13% | 3.53% |  |
Top three noisy pixels from each quadrant. If the there are fewer than three noisy pixels in the level2.evt file, extra rows are filled as -1
| Pixel properties | Quadrant properties | ||||||
|---|---|---|---|---|---|---|---|
| Quadrant | DetID | PixID | Counts | Sigma | Mean | Median | Sigma |
| A | 0 | 231 | 2016825 | 475.45 | 17490 | 17627 | 4204.8 |
| A | 0 | 128 | 267013 | 59.31 | 17490 | 17627 | 4204.8 |
| A | 15 | 236 | 179428 | 38.48 | 17490 | 17627 | 4204.8 |
| B | 8 | 3 | 348049 | 77.43 | 18223 | 18373 | 4257.9 |
| B | 0 | 220 | 144161 | 29.54 | 18223 | 18373 | 4257.9 |
| B | 0 | 182 | 91087 | 17.08 | 18223 | 18373 | 4257.9 |
| C | 8 | 229 | 196727 | 38.68 | 16612 | 17217 | 4641.0 |
| C | 10 | 34 | 98447 | 17.5 | 16612 | 17217 | 4641.0 |
| C | 2 | 53 | 76790 | 12.84 | 16612 | 17217 | 4641.0 |
| D | 7 | 85 | 4364804 | 869.73 | 16059 | 16695 | 4999.4 |
| D | 7 | 34 | 833064 | 163.29 | 16059 | 16695 | 4999.4 |
| D | 2 | 54 | 394649 | 75.6 | 16059 | 16695 | 4999.4 |
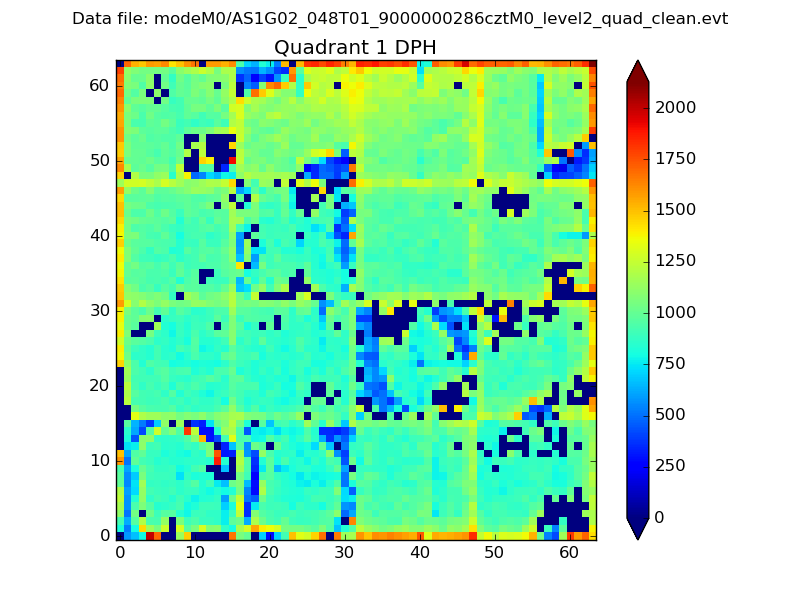
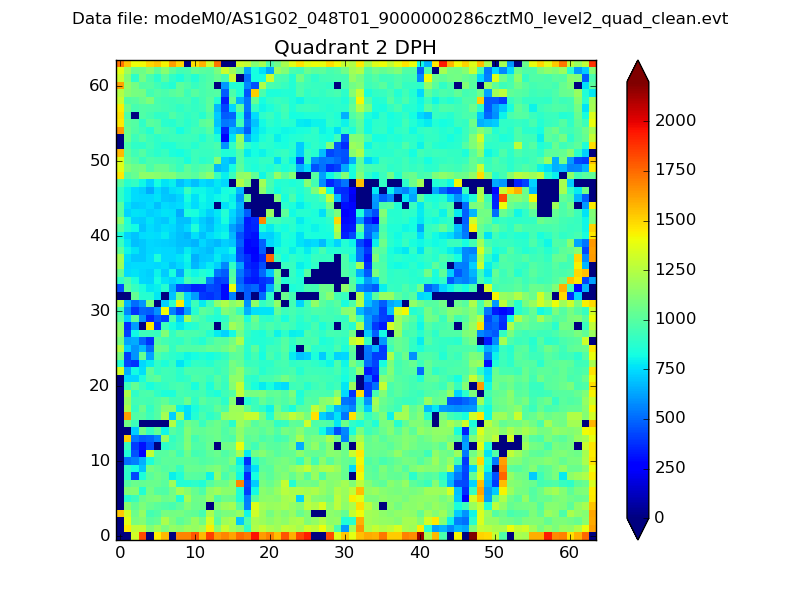
Histogram calculated using DETX and DETY for each event in the final _common_clean file
| Quadrant A |  |
 |
Quadrant B |
|---|---|---|---|
| Quadrant D |  |
 |
Quadrant C |
| Plot type | Count rate plots | Images |
|---|---|---|
| Comparison with Poisson distribution Blue bars denote a histogram of data divided into 1 sec bins. Red curve is a Poisson curve with rate = median count rate of data. |
 |
 |
| Quadrant-wise count rates Data is divided into 100 sec bins |
 |
|
| Module-wise count rates for Quadrant A Data is divided into 100 sec bins |
 |
 |
| Module-wise count rates for Quadrant B Data is divided into 100 sec bins |
 |
 |
| Module-wise count rates for Quadrant C Data is divided into 100 sec bins |
 |
 |
| Module-wise count rates for Quadrant D Data is divided into 100 sec bins |
 |
 |
| Parameter | Plot |
|---|---|
| CZT HV Monitor |  |
| D_VDD |  |
| Temperature 1 |  |
| Veto HV Monitor | 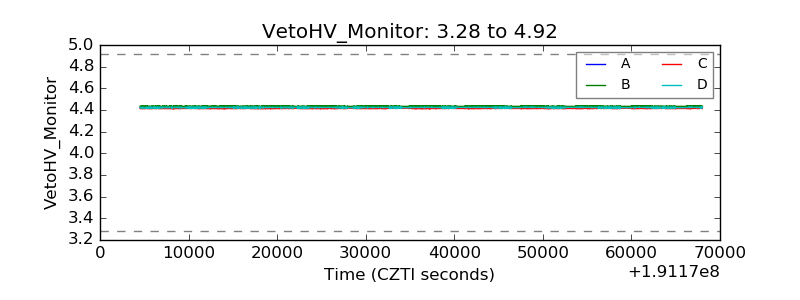 |
| Veto LLD |  |
| Alpha Counter |  |
| _CPM_Rate |  |
| CZT Counter |  |
| +2.5 Volts monitor | 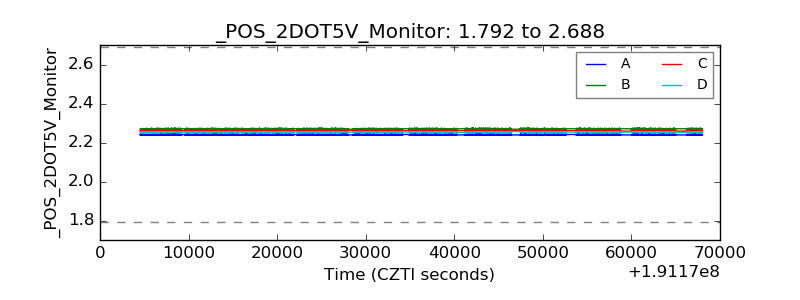 |
| +5 Volts monitor |  |
| _ROLL_ROT |  |
| _Roll_DEC | 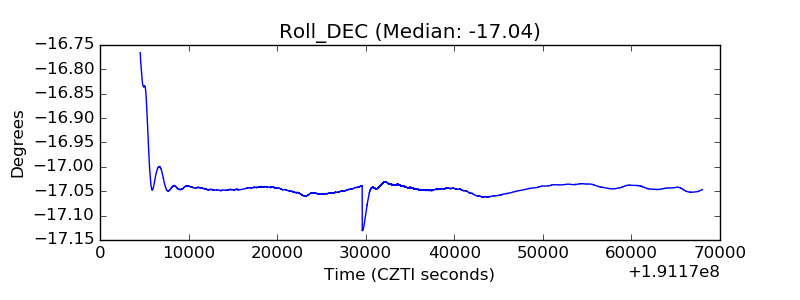 |
| _Roll_RA |  |
| Veto Counter | 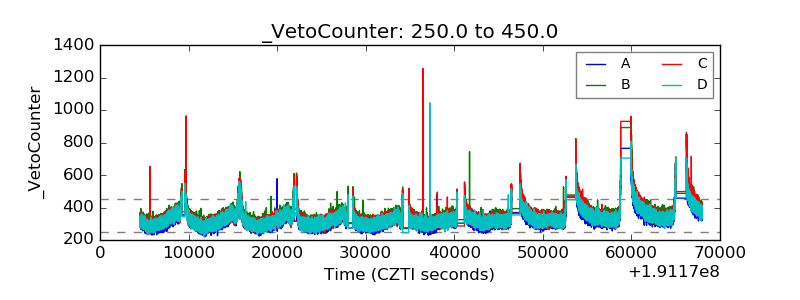 |