| Param | Original file | Final file |
|---|---|---|
| Filename | modeM0/AS1G02_050T01_9000000282cztM0_level2_bc.evt | modeM0/AS1G02_050T01_9000000282cztM0_level2_quad_clean.evt |
| Size (bytes) | 1,864,137,600 | 671,362,560 |
| Size | 1.7 GB | 640.3 MB |
| Events in quadrant A | 10,992,118 | 4,155,138 |
| Events in quadrant B | 15,862,873 | 4,145,933 |
| Events in quadrant C | 11,744,068 | 4,048,662 |
| Events in quadrant D | 13,829,294 | 3,935,800 |
| Mode SS | |||
|---|---|---|---|
| Quadrant | BADHDUFLAG | Total packets | Discarded packets |
| A | 0 | 1202 | 0 |
| B | 0 | 1202 | 0 |
| C | 0 | 1202 | 0 |
| D | 0 | 1202 | 0 |
| Mode M0 | |||
|---|---|---|---|
| Quadrant | BADHDUFLAG | Total packets | Discarded packets |
| A | 0 | 256262 | 0 |
| B | 0 | 276173 | 0 |
| C | 0 | 250838 | 0 |
| D | 0 | 249998 | 0 |
| Mode M9 | |||
|---|---|---|---|
| Quadrant | BADHDUFLAG | Total packets | Discarded packets |
| A | 0 | 85 | 0 |
| B | 0 | 85 | 0 |
| C | 0 | 85 | 0 |
| D | 0 | 85 | 0 |
| Quadrant | Total seconds | Saturated seconds | Saturation percentage |
|---|---|---|---|
| A | 59019 | 501 | 0.848879% |
| B | 59019 | 536 | 0.908182% |
| C | 59019 | 696 | 1.179281% |
| D | 59019 | 1475 | 2.499195% |
Noise dominated data is calculated using 1-second bins in cleaned event files. If a bin has >2000 counts, and if more than 50% of those come from <1% of pixels, then it is considered to be noise-dominated and hence unusable.
| Quadrant | # 1 sec bins | Bins with >0 counts | Bins with >2000 counts | High rate bins dominated by noise | Noise dominated (total time) | Noise dominated (detector-on time) | Marked lightcurve |
|---|---|---|---|---|---|---|---|
| A | 67594 | 59012 | 0 | 0 | 0.00% | 0.00% |  |
| B | 67594 | 59013 | 15 | 15 | 0.02% | 0.03% |  |
| C | 67594 | 59015 | 23 | 23 | 0.03% | 0.04% |  |
| D | 67593 | 58982 | 177 | 177 | 0.26% | 0.30% | 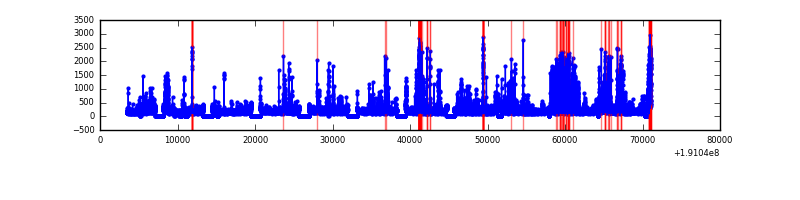 |
Top three noisy pixels from each quadrant. If the there are fewer than three noisy pixels in the level2.evt file, extra rows are filled as -1
| Pixel properties | Quadrant properties | ||||||
|---|---|---|---|---|---|---|---|
| Quadrant | DetID | PixID | Counts | Sigma | Mean | Median | Sigma |
| A | 8 | 14 | 154820 | 269.15 | 2735 | 2670 | 565.3 |
| A | 15 | 143 | 101279 | 174.43 | 2735 | 2670 | 565.3 |
| A | 8 | 15 | 64122 | 108.71 | 2735 | 2670 | 565.3 |
| B | 8 | 3 | 4424189 | 9024.6 | 2784 | 2696 | 489.9 |
| B | 0 | 234 | 345115 | 698.9 | 2784 | 2696 | 489.9 |
| B | 5 | 189 | 177756 | 357.31 | 2784 | 2696 | 489.9 |
| C | 9 | 236 | 874138 | 1594.02 | 2654 | 2602 | 546.8 |
| C | 8 | 208 | 275069 | 498.34 | 2654 | 2602 | 546.8 |
| C | 12 | 4 | 117707 | 210.52 | 2654 | 2602 | 546.8 |
| D | 7 | 85 | 1386418 | 2429.58 | 2653 | 2559 | 569.6 |
| D | 7 | 204 | 664909 | 1162.86 | 2653 | 2559 | 569.6 |
| D | 1 | 83 | 439073 | 766.37 | 2653 | 2559 | 569.6 |
Histogram calculated using DETX and DETY for each event in the final _common_clean file
| Quadrant A |  |
 |
Quadrant B |
|---|---|---|---|
| Quadrant D | 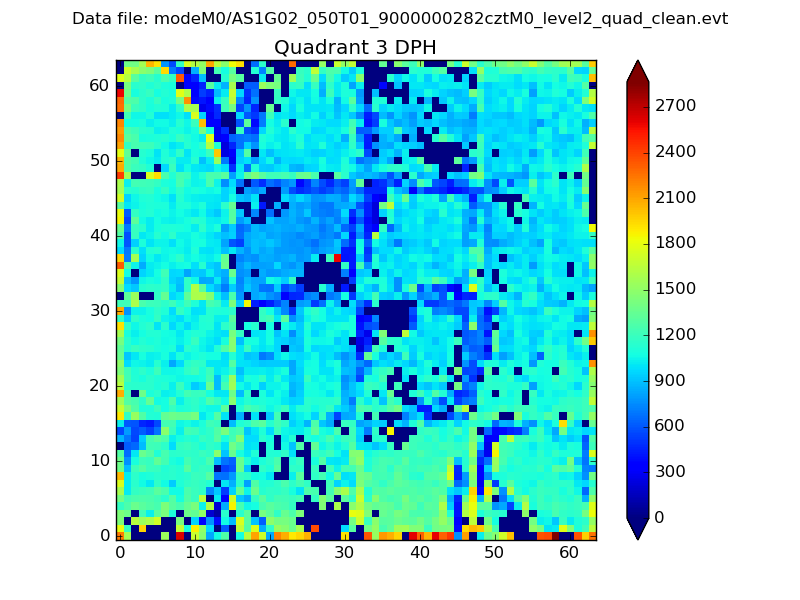 |
 |
Quadrant C |
| Plot type | Count rate plots | Images |
|---|---|---|
| Comparison with Poisson distribution Blue bars denote a histogram of data divided into 1 sec bins. Red curve is a Poisson curve with rate = median count rate of data. |
 |
 |
| Quadrant-wise count rates Data is divided into 100 sec bins |
 |
|
| Module-wise count rates for Quadrant A Data is divided into 100 sec bins |
 |
 |
| Module-wise count rates for Quadrant B Data is divided into 100 sec bins |
 |
 |
| Module-wise count rates for Quadrant C Data is divided into 100 sec bins |
 |
 |
| Module-wise count rates for Quadrant D Data is divided into 100 sec bins |
 |
 |
| Parameter | Plot |
|---|---|
| CZT HV Monitor |  |
| D_VDD |  |
| Temperature 1 | 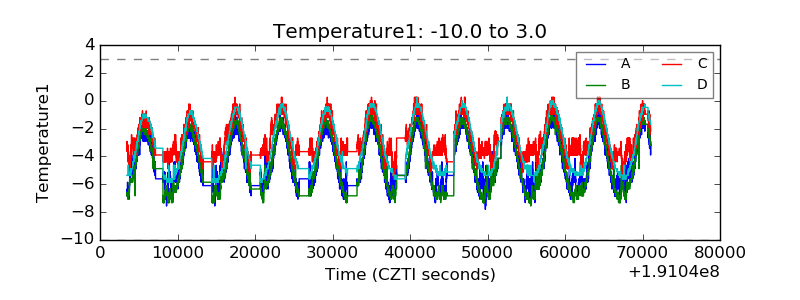 |
| Veto HV Monitor |  |
| Veto LLD | 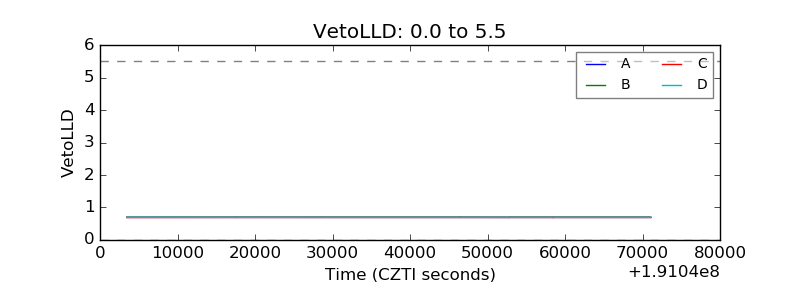 |
| Alpha Counter |  |
| _CPM_Rate | 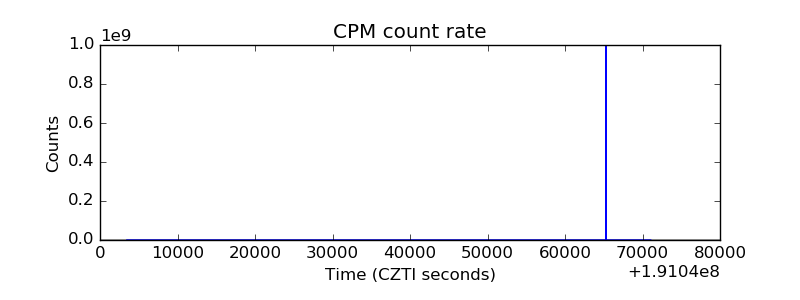 |
| CZT Counter |  |
| +2.5 Volts monitor |  |
| +5 Volts monitor |  |
| _ROLL_ROT | 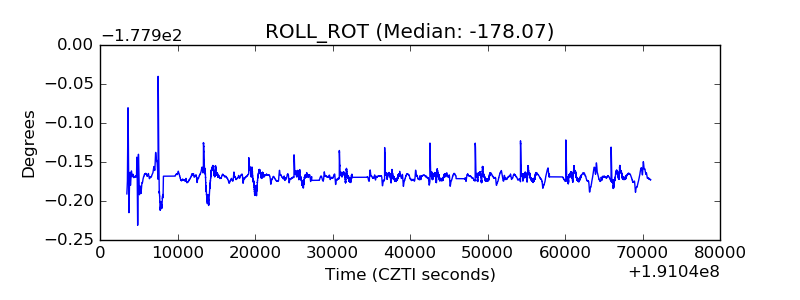 |
| _Roll_DEC | 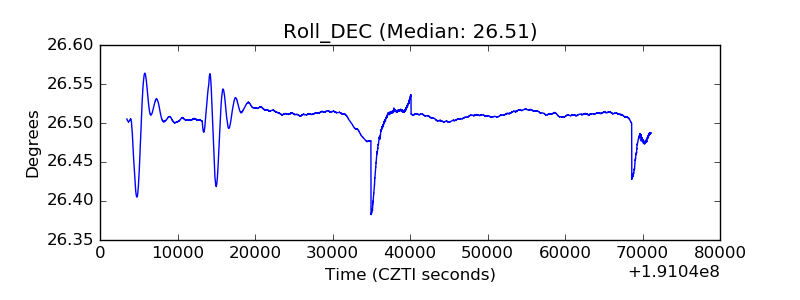 |
| _Roll_RA |  |
| Veto Counter |  |