| Param | Original file | Final file |
|---|---|---|
| Filename | modeM0/AS1G02_051T01_9000000278cztM0_level2.evt | modeM0/AS1G02_051T01_9000000278cztM0_level2_quad_clean.evt |
| Size (bytes) | 9,881,910,720 | 714,876,480 |
| Size | 9.2 GB | 681.8 MB |
| Events in quadrant A | 74,425,951 | 4,383,626 |
| Events in quadrant B | 79,019,314 | 4,441,983 |
| Events in quadrant C | 71,995,129 | 4,373,664 |
| Events in quadrant D | 69,784,126 | 4,232,702 |
| Mode M9 | |||
|---|---|---|---|
| Quadrant | BADHDUFLAG | Total packets | Discarded packets |
| A | 0 | 98 | 0 |
| B | 0 | 98 | 0 |
| C | 0 | 98 | 0 |
| D | 0 | 98 | 0 |
| Mode M0 | |||
|---|---|---|---|
| Quadrant | BADHDUFLAG | Total packets | Discarded packets |
| A | 0 | 264876 | 0 |
| B | 0 | 278411 | 0 |
| C | 0 | 257560 | 0 |
| D | 0 | 251318 | 0 |
| Mode SS | |||
|---|---|---|---|
| Quadrant | BADHDUFLAG | Total packets | Discarded packets |
| A | 0 | 1250 | 0 |
| B | 0 | 1250 | 0 |
| C | 0 | 1250 | 0 |
| D | 0 | 1250 | 0 |
| Quadrant | Total seconds | Saturated seconds | Saturation percentage |
|---|---|---|---|
| A | 61546 | 505 | 0.820524% |
| B | 61546 | 614 | 0.997628% |
| C | 61545 | 360 | 0.584938% |
| D | 61544 | 909 | 1.476992% |
Noise dominated data is calculated using 1-second bins in cleaned event files. If a bin has >2000 counts, and if more than 50% of those come from <1% of pixels, then it is considered to be noise-dominated and hence unusable.
| Quadrant | # 1 sec bins | Bins with >0 counts | Bins with >2000 counts | High rate bins dominated by noise | Noise dominated (total time) | Noise dominated (detector-on time) | Marked lightcurve |
|---|---|---|---|---|---|---|---|
| A | 71211 | 61551 | 2475 | 2475 | 3.48% | 4.02% |  |
| B | 71211 | 61552 | 3302 | 3302 | 4.64% | 5.36% |  |
| C | 71211 | 61552 | 1974 | 1974 | 2.77% | 3.21% |  |
| D | 71209 | 61549 | 2501 | 2501 | 3.51% | 4.06% |  |
Top three noisy pixels from each quadrant. If the there are fewer than three noisy pixels in the level2.evt file, extra rows are filled as -1
| Pixel properties | Quadrant properties | ||||||
|---|---|---|---|---|---|---|---|
| Quadrant | DetID | PixID | Counts | Sigma | Mean | Median | Sigma |
| A | 8 | 14 | 96516 | 16.51 | 19406 | 19530 | 4662.9 |
| A | 8 | 255 | 71491 | 11.14 | 19406 | 19530 | 4662.9 |
| A | 8 | 15 | 55939 | 7.81 | 19406 | 19530 | 4662.9 |
| B | 7 | 205 | 1749275 | 367.66 | 20099 | 20208 | 4702.9 |
| B | 0 | 234 | 599877 | 123.26 | 20099 | 20208 | 4702.9 |
| B | 0 | 220 | 190211 | 36.15 | 20099 | 20208 | 4702.9 |
| C | 1 | 192 | 130561 | 21.83 | 18388 | 19065 | 5108.6 |
| C | 8 | 208 | 64965 | 8.98 | 18388 | 19065 | 5108.6 |
| C | 8 | 229 | 62773 | 8.56 | 18388 | 19065 | 5108.6 |
| D | 13 | 105 | 770632 | 145.58 | 18041 | 18477 | 5166.5 |
| D | 13 | 53 | 622608 | 116.93 | 18041 | 18477 | 5166.5 |
| D | 2 | 54 | 353726 | 64.89 | 18041 | 18477 | 5166.5 |
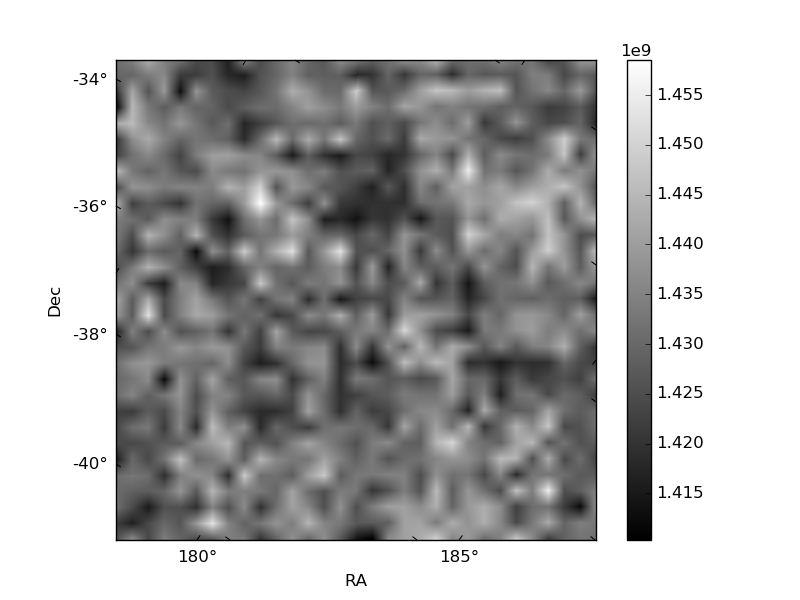
Histogram calculated using DETX and DETY for each event in the final _common_clean file
| Quadrant A |  |
 |
Quadrant B |
|---|---|---|---|
| Quadrant D |  |
 |
Quadrant C |
| Plot type | Count rate plots | Images |
|---|---|---|
| Comparison with Poisson distribution Blue bars denote a histogram of data divided into 1 sec bins. Red curve is a Poisson curve with rate = median count rate of data. |
 |
 |
| Quadrant-wise count rates Data is divided into 100 sec bins |
 |
|
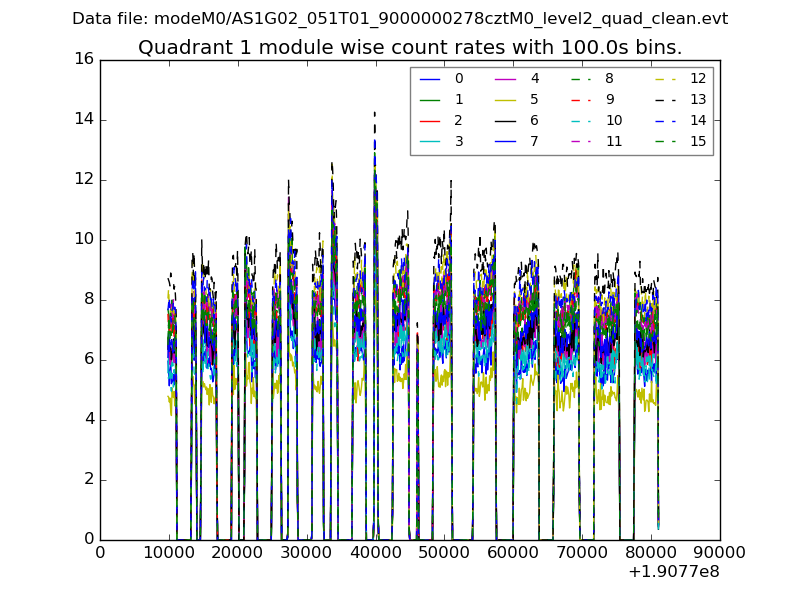
| Module-wise count rates for Quadrant A Data is divided into 100 sec bins |
 |
 |
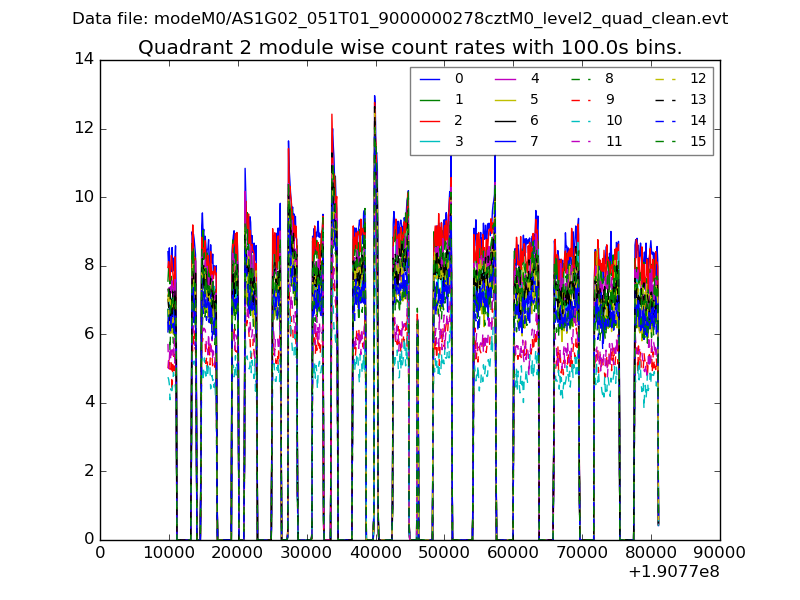
| Module-wise count rates for Quadrant B Data is divided into 100 sec bins |
 |
 |
| Module-wise count rates for Quadrant C Data is divided into 100 sec bins |
 |
 |
| Module-wise count rates for Quadrant D Data is divided into 100 sec bins |
 |
 |
| Parameter | Plot |
|---|---|
| CZT HV Monitor |  |
| D_VDD | 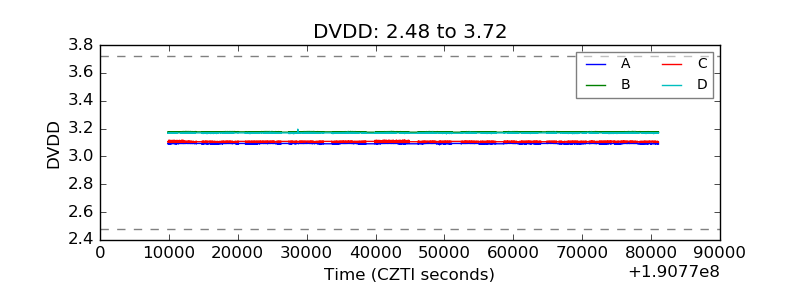 |
| Temperature 1 |  |
| Veto HV Monitor |  |
| Veto LLD |  |
| Alpha Counter |  |
| _CPM_Rate |  |
| CZT Counter |  |
| +2.5 Volts monitor | 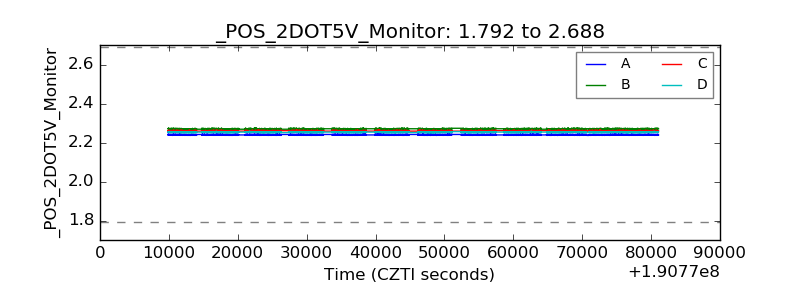 |
| +5 Volts monitor | 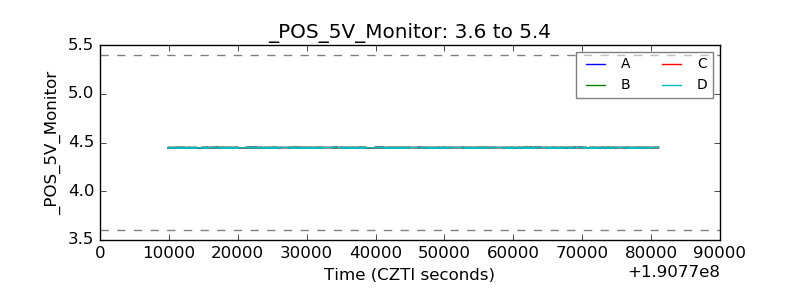 |
| _ROLL_ROT | 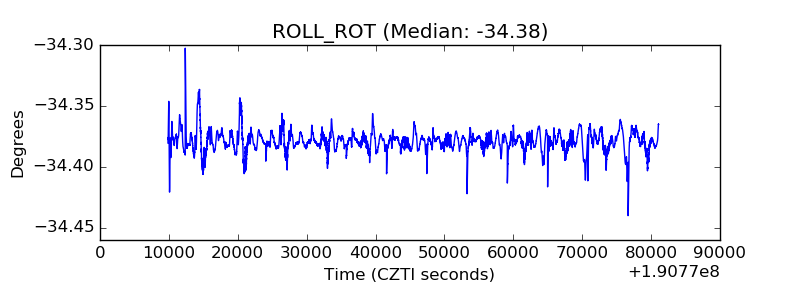 |
| _Roll_DEC |  |
| _Roll_RA |  |
| Veto Counter |  |