| Param | Original file | Final file |
|---|---|---|
| Filename | modeM0/AS1G02_049T01_9000000280cztM0_level2.evt | modeM0/AS1G02_049T01_9000000280cztM0_level2_quad_clean.evt |
| Size (bytes) | 21,757,472,640 | 2,323,802,880 |
| Size | 20.3 GB | 2.2 GB |
| Events in quadrant A | 161,852,064 | 15,543,184 |
| Events in quadrant B | 183,923,371 | 15,607,039 |
| Events in quadrant C | 154,480,982 | 15,138,934 |
| Events in quadrant D | 149,771,274 | 14,835,947 |
| Mode M0 | |||
|---|---|---|---|
| Quadrant | BADHDUFLAG | Total packets | Discarded packets |
| A | 0 | 577250 | 0 |
| B | 0 | 642487 | 0 |
| C | 0 | 555045 | 0 |
| D | 0 | 541324 | 0 |
| Mode M9 | |||
|---|---|---|---|
| Quadrant | BADHDUFLAG | Total packets | Discarded packets |
| A | 0 | 196 | 0 |
| B | 0 | 193 | 0 |
| C | 0 | 196 | 0 |
| D | 0 | 194 | 0 |
| Mode SS | |||
|---|---|---|---|
| Quadrant | BADHDUFLAG | Total packets | Discarded packets |
| A | 0 | 2804 | 0 |
| B | 0 | 2801 | 0 |
| C | 0 | 2740 | 0 |
| D | 0 | 2742 | 0 |
| Quadrant | Total seconds | Saturated seconds | Saturation percentage |
|---|---|---|---|
| A | 135959 | 501 | 0.368493% |
| B | 135958 | 1492 | 1.097398% |
| C | 134620 | 342 | 0.254048% |
| D | 134661 | 809 | 0.600768% |
Noise dominated data is calculated using 1-second bins in cleaned event files. If a bin has >2000 counts, and if more than 50% of those come from <1% of pixels, then it is considered to be noise-dominated and hence unusable.
| Quadrant | # 1 sec bins | Bins with >0 counts | Bins with >2000 counts | High rate bins dominated by noise | Noise dominated (total time) | Noise dominated (detector-on time) | Marked lightcurve |
|---|---|---|---|---|---|---|---|
| A | 183672 | 135986 | 4322 | 4322 | 2.35% | 3.18% | 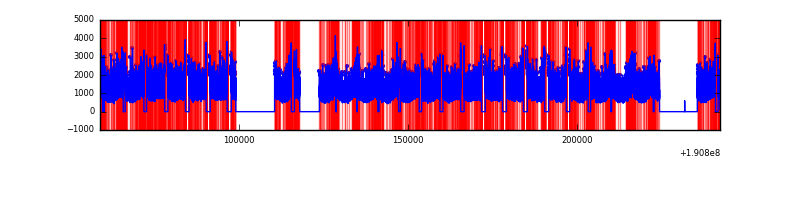 |
| B | 183672 | 135994 | 10717 | 10717 | 5.83% | 7.88% |  |
| C | 183672 | 134661 | 3708 | 3708 | 2.02% | 2.75% |  |
| D | 183672 | 134700 | 4078 | 4078 | 2.22% | 3.03% |  |
Top three noisy pixels from each quadrant. If the there are fewer than three noisy pixels in the level2.evt file, extra rows are filled as -1
| Pixel properties | Quadrant properties | ||||||
|---|---|---|---|---|---|---|---|
| Quadrant | DetID | PixID | Counts | Sigma | Mean | Median | Sigma |
| A | 14 | 5 | 911567 | 86.44 | 41920 | 42130 | 10058.8 |
| A | 8 | 14 | 375716 | 33.16 | 41920 | 42130 | 10058.8 |
| A | 8 | 15 | 228498 | 18.53 | 41920 | 42130 | 10058.8 |
| B | 8 | 3 | 17055128 | 1666.0 | 43463 | 43614 | 10211.0 |
| B | 0 | 234 | 1483910 | 141.05 | 43463 | 43614 | 10211.0 |
| B | 0 | 220 | 401159 | 35.02 | 43463 | 43614 | 10211.0 |
| C | 9 | 203 | 624398 | 53.4 | 39241 | 40574 | 10933.3 |
| C | 8 | 208 | 348686 | 28.18 | 39241 | 40574 | 10933.3 |
| C | 12 | 4 | 177124 | 12.49 | 39241 | 40574 | 10933.3 |
| D | 13 | 105 | 1451087 | 129.44 | 38886 | 39774 | 10902.9 |
| D | 1 | 84 | 1041201 | 91.85 | 38886 | 39774 | 10902.9 |
| D | 1 | 83 | 685850 | 59.26 | 38886 | 39774 | 10902.9 |
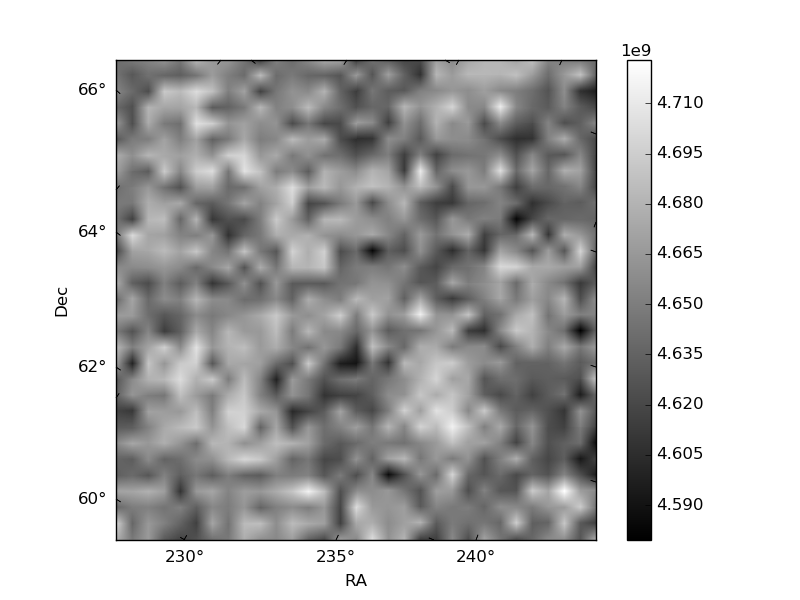
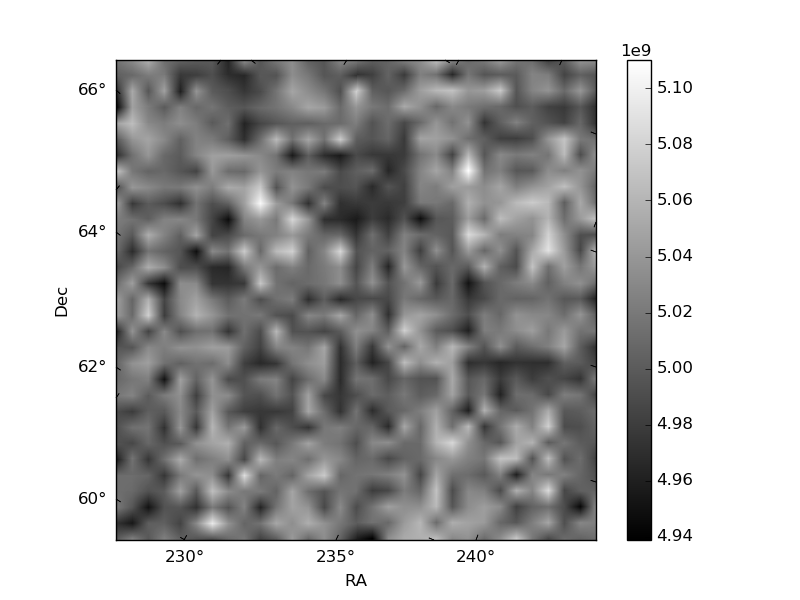
Histogram calculated using DETX and DETY for each event in the final _common_clean file
| Quadrant A | 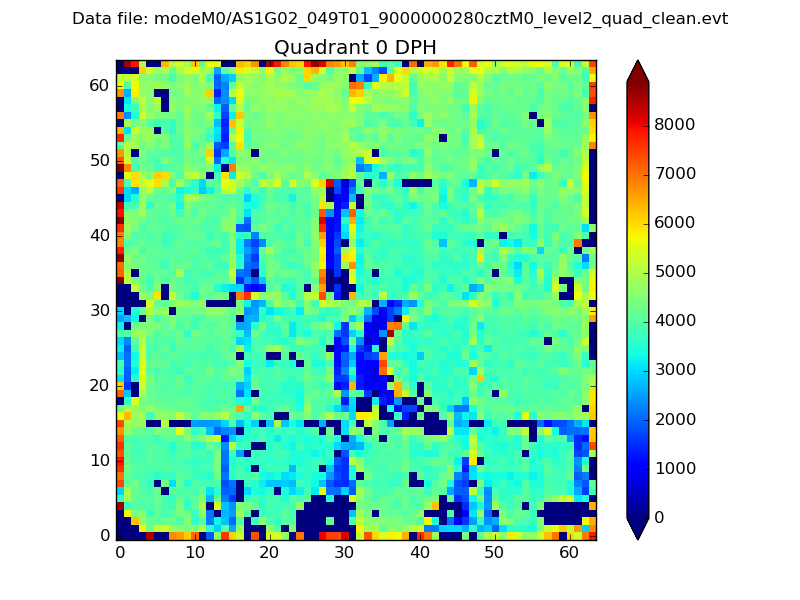 |
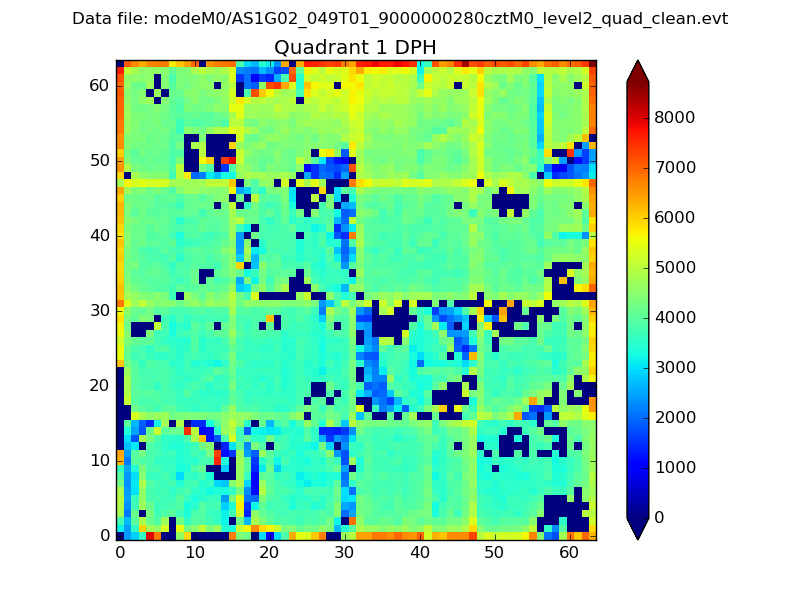 |
Quadrant B |
|---|---|---|---|
| Quadrant D |  |
 |
Quadrant C |
| Plot type | Count rate plots | Images |
|---|---|---|
| Comparison with Poisson distribution Blue bars denote a histogram of data divided into 1 sec bins. Red curve is a Poisson curve with rate = median count rate of data. |
 |
 |
| Quadrant-wise count rates Data is divided into 100 sec bins |
 |
|
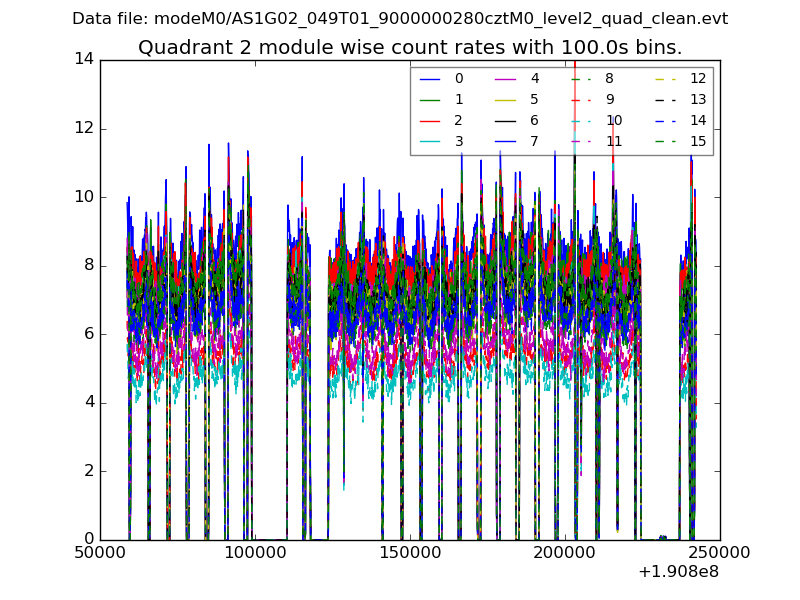
| Module-wise count rates for Quadrant A Data is divided into 100 sec bins |
 |
 |
| Module-wise count rates for Quadrant B Data is divided into 100 sec bins |
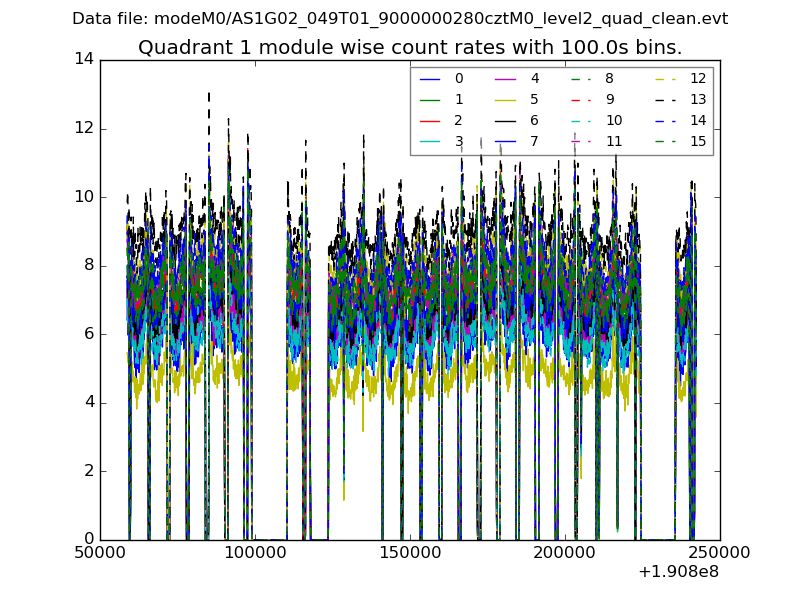 |
 |
| Module-wise count rates for Quadrant C Data is divided into 100 sec bins |
 |
 |
| Module-wise count rates for Quadrant D Data is divided into 100 sec bins |
 |
 |
| Parameter | Plot |
|---|---|
| CZT HV Monitor |  |
| D_VDD |  |
| Temperature 1 | 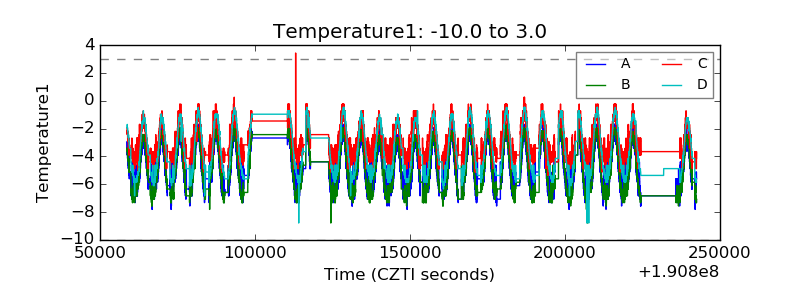 |
| Veto HV Monitor |  |
| Veto LLD |  |
| Alpha Counter |  |
| _CPM_Rate | 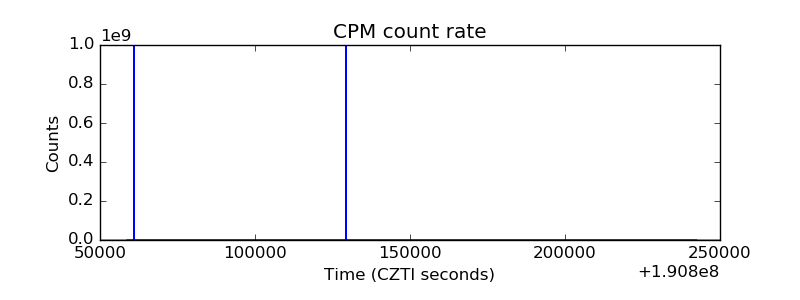 |
| CZT Counter | 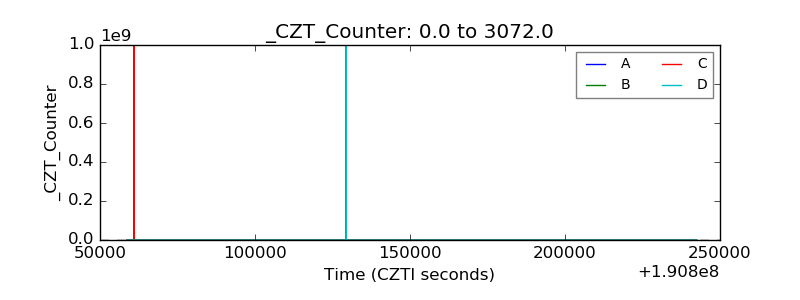 |
| +2.5 Volts monitor |  |
| +5 Volts monitor |  |
| _ROLL_ROT | 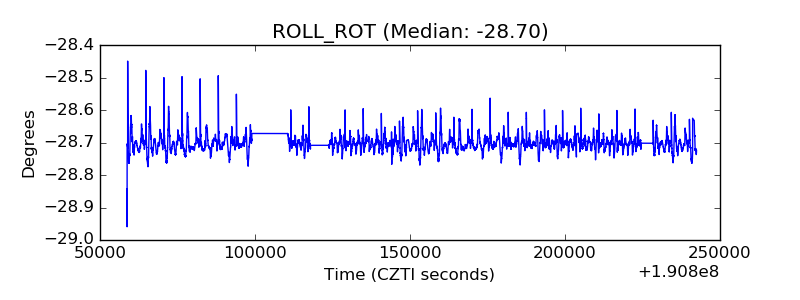 |
| _Roll_DEC |  |
| _Roll_RA |  |
| Veto Counter | 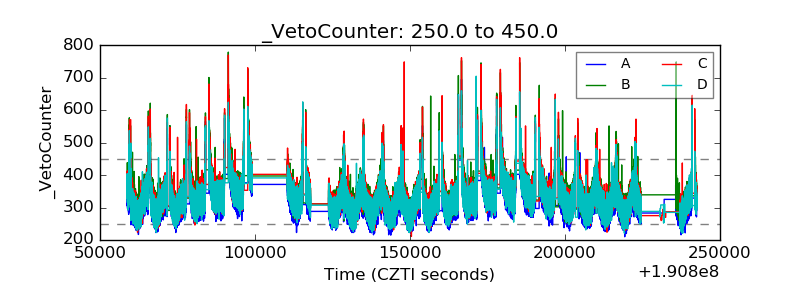 |