| Param | Original file | Final file |
|---|---|---|
| Filename | modeM0/AS1G02_052T02_9000000276cztM0_level2_bc.evt | modeM0/AS1G02_052T02_9000000276cztM0_level2_quad_clean.evt |
| Size (bytes) | 3,403,008,000 | 1,229,423,040 |
| Size | 3.2 GB | 1.1 GB |
| Events in quadrant A | 20,542,480 | 7,580,698 |
| Events in quadrant B | 29,758,414 | 7,661,288 |
| Events in quadrant C | 21,117,648 | 7,593,668 |
| Events in quadrant D | 24,586,816 | 7,308,396 |
| Mode M9 | |||
|---|---|---|---|
| Quadrant | BADHDUFLAG | Total packets | Discarded packets |
| A | 0 | 188 | 0 |
| B | 0 | 188 | 0 |
| C | 0 | 188 | 0 |
| D | 0 | 188 | 0 |
| Mode M0 | |||
|---|---|---|---|
| Quadrant | BADHDUFLAG | Total packets | Discarded packets |
| A | 0 | 479044 | 0 |
| B | 0 | 525951 | 0 |
| C | 0 | 468008 | 0 |
| D | 0 | 471753 | 0 |
| Mode SS | |||
|---|---|---|---|
| Quadrant | BADHDUFLAG | Total packets | Discarded packets |
| A | 0 | 1142 | 0 |
| B | 0 | 1143 | 0 |
| C | 0 | 1148 | 0 |
| D | 0 | 1145 | 0 |
| Quadrant | Total seconds | Saturated seconds | Saturation percentage |
|---|---|---|---|
| A | 110709 | 734 | 0.662999% |
| B | 110678 | 2448 | 2.211822% |
| C | 110730 | 615 | 0.555405% |
| D | 110658 | 2567 | 2.319760% |
Noise dominated data is calculated using 1-second bins in cleaned event files. If a bin has >2000 counts, and if more than 50% of those come from <1% of pixels, then it is considered to be noise-dominated and hence unusable.
| Quadrant | # 1 sec bins | Bins with >0 counts | Bins with >2000 counts | High rate bins dominated by noise | Noise dominated (total time) | Noise dominated (detector-on time) | Marked lightcurve |
|---|---|---|---|---|---|---|---|
| A | 161575 | 111551 | 1 | 1 | 0.00% | 0.00% |  |
| B | 161575 | 111558 | 181 | 181 | 0.11% | 0.16% | 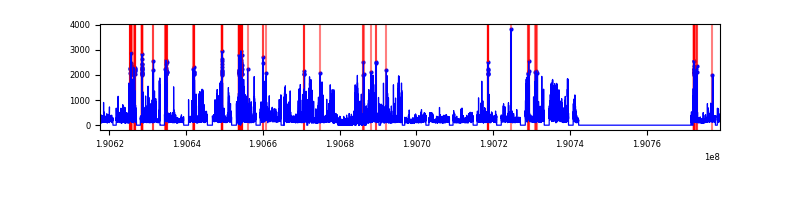 |
| C | 161575 | 111596 | 52 | 52 | 0.03% | 0.05% |  |
| D | 161575 | 111409 | 216 | 216 | 0.13% | 0.19% |  |
Top three noisy pixels from each quadrant. If the there are fewer than three noisy pixels in the level2.evt file, extra rows are filled as -1
| Pixel properties | Quadrant properties | ||||||
|---|---|---|---|---|---|---|---|
| Quadrant | DetID | PixID | Counts | Sigma | Mean | Median | Sigma |
| A | 8 | 14 | 438453 | 408.86 | 5145 | 5016 | 1060.1 |
| A | 13 | 9 | 96281 | 86.09 | 5145 | 5016 | 1060.1 |
| A | 8 | 15 | 68422 | 59.81 | 5145 | 5016 | 1060.1 |
| B | 7 | 205 | 7868316 | 8670.44 | 5210 | 5041 | 906.9 |
| B | 0 | 234 | 1002140 | 1099.45 | 5210 | 5041 | 906.9 |
| B | 8 | 3 | 246598 | 266.35 | 5210 | 5041 | 906.9 |
| C | 2 | 53 | 730817 | 711.0 | 5072 | 4972 | 1020.9 |
| C | 12 | 4 | 223331 | 213.89 | 5072 | 4972 | 1020.9 |
| C | 9 | 70 | 67325 | 61.08 | 5072 | 4972 | 1020.9 |
| D | 13 | 53 | 1977486 | 1836.35 | 5035 | 4872 | 1074.2 |
| D | 2 | 152 | 592396 | 546.94 | 5035 | 4872 | 1074.2 |
| D | 13 | 105 | 564992 | 521.43 | 5035 | 4872 | 1074.2 |
Histogram calculated using DETX and DETY for each event in the final _common_clean file
| Quadrant A |  |
 |
Quadrant B |
|---|---|---|---|
| Quadrant D |  |
 |
Quadrant C |
| Plot type | Count rate plots | Images |
|---|---|---|
| Comparison with Poisson distribution Blue bars denote a histogram of data divided into 1 sec bins. Red curve is a Poisson curve with rate = median count rate of data. |
 |
 |
| Quadrant-wise count rates Data is divided into 100 sec bins |
 |
|
| Module-wise count rates for Quadrant A Data is divided into 100 sec bins |
 |
 |
| Module-wise count rates for Quadrant B Data is divided into 100 sec bins |
 |
 |
| Module-wise count rates for Quadrant C Data is divided into 100 sec bins |
 |
 |
| Module-wise count rates for Quadrant D Data is divided into 100 sec bins |
 |
 |
| Parameter | Plot |
|---|---|
| CZT HV Monitor |  |
| D_VDD |  |
| Temperature 1 |  |
| Veto HV Monitor |  |
| Veto LLD | 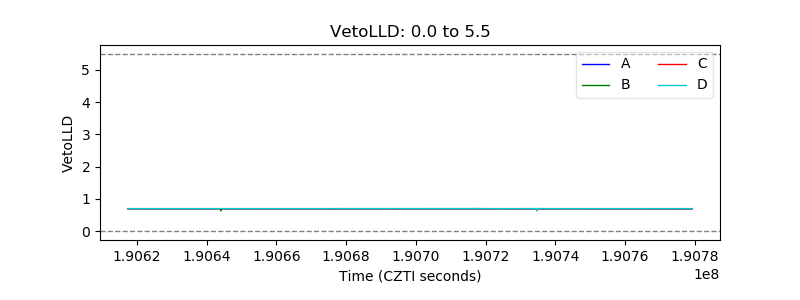 |
| Alpha Counter |  |
| _CPM_Rate |  |
| CZT Counter |  |
| +2.5 Volts monitor |  |
| +5 Volts monitor |  |
| _ROLL_ROT | 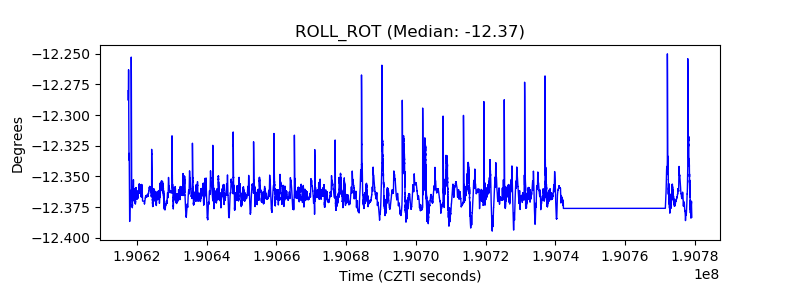 |
| _Roll_DEC |  |
| _Roll_RA |  |
| Veto Counter |  |