| Param | Original file | Final file |
|---|---|---|
| Filename | modeM0/AS1G02_021T07_9000000274cztM0_level2.evt | modeM0/AS1G02_021T07_9000000274cztM0_level2_quad_clean.evt |
| Size (bytes) | 8,789,682,240 | 957,191,040 |
| Size | 8.2 GB | 912.8 MB |
| Events in quadrant A | 66,031,958 | 6,383,132 |
| Events in quadrant B | 69,526,280 | 6,490,031 |
| Events in quadrant C | 63,410,575 | 6,287,232 |
| Events in quadrant D | 63,587,983 | 6,043,788 |
| Mode M9 | |||
|---|---|---|---|
| Quadrant | BADHDUFLAG | Total packets | Discarded packets |
| A | 0 | 68 | 0 |
| B | 0 | 68 | 0 |
| C | 0 | 68 | 0 |
| D | 0 | 68 | 0 |
| Mode SS | |||
|---|---|---|---|
| Quadrant | BADHDUFLAG | Total packets | Discarded packets |
| A | 0 | 1120 | 0 |
| B | 0 | 1120 | 0 |
| C | 0 | 1120 | 0 |
| D | 0 | 1120 | 0 |
| Mode M0 | |||
|---|---|---|---|
| Quadrant | BADHDUFLAG | Total packets | Discarded packets |
| A | 0 | 235362 | 0 |
| B | 0 | 245687 | 0 |
| C | 0 | 227699 | 0 |
| D | 0 | 228553 | 0 |
| Quadrant | Total seconds | Saturated seconds | Saturation percentage |
|---|---|---|---|
| A | 55273 | 258 | 0.466774% |
| B | 55273 | 257 | 0.464965% |
| C | 55273 | 237 | 0.428781% |
| D | 55273 | 1100 | 1.990122% |
Noise dominated data is calculated using 1-second bins in cleaned event files. If a bin has >2000 counts, and if more than 50% of those come from <1% of pixels, then it is considered to be noise-dominated and hence unusable.
| Quadrant | # 1 sec bins | Bins with >0 counts | Bins with >2000 counts | High rate bins dominated by noise | Noise dominated (total time) | Noise dominated (detector-on time) | Marked lightcurve |
|---|---|---|---|---|---|---|---|
| A | 62073 | 55281 | 2080 | 2080 | 3.35% | 3.76% | 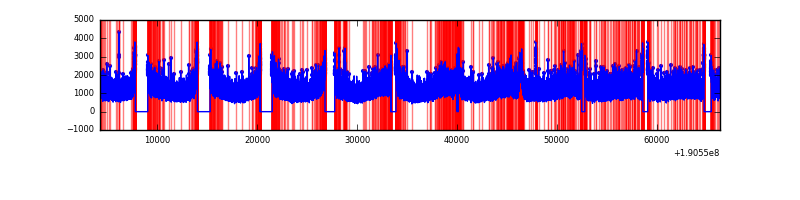 |
| B | 62073 | 55283 | 2471 | 2471 | 3.98% | 4.47% |  |
| C | 62073 | 55283 | 1666 | 1666 | 2.68% | 3.01% |  |
| D | 62073 | 55283 | 2838 | 2838 | 4.57% | 5.13% |  |
Top three noisy pixels from each quadrant. If the there are fewer than three noisy pixels in the level2.evt file, extra rows are filled as -1
| Pixel properties | Quadrant properties | ||||||
|---|---|---|---|---|---|---|---|
| Quadrant | DetID | PixID | Counts | Sigma | Mean | Median | Sigma |
| A | 8 | 14 | 216617 | 48.63 | 17116 | 17194 | 4101.1 |
| A | 12 | 133 | 127658 | 26.93 | 17116 | 17194 | 4101.1 |
| A | 8 | 15 | 109549 | 22.52 | 17116 | 17194 | 4101.1 |
| B | 8 | 3 | 712632 | 165.04 | 17927 | 17981 | 4209.0 |
| B | 0 | 234 | 621341 | 143.35 | 17927 | 17981 | 4209.0 |
| B | 15 | 85 | 125401 | 25.52 | 17927 | 17981 | 4209.0 |
| C | 8 | 229 | 269095 | 56.22 | 16167 | 16687 | 4489.8 |
| C | 9 | 68 | 47166 | 6.79 | 16167 | 16687 | 4489.8 |
| C | 7 | 159 | 42005 | 5.64 | 16167 | 16687 | 4489.8 |
| D | 13 | 105 | 1949268 | 429.91 | 15737 | 16065 | 4496.7 |
| D | 13 | 53 | 1494827 | 328.85 | 15737 | 16065 | 4496.7 |
| D | 1 | 84 | 750267 | 163.27 | 15737 | 16065 | 4496.7 |
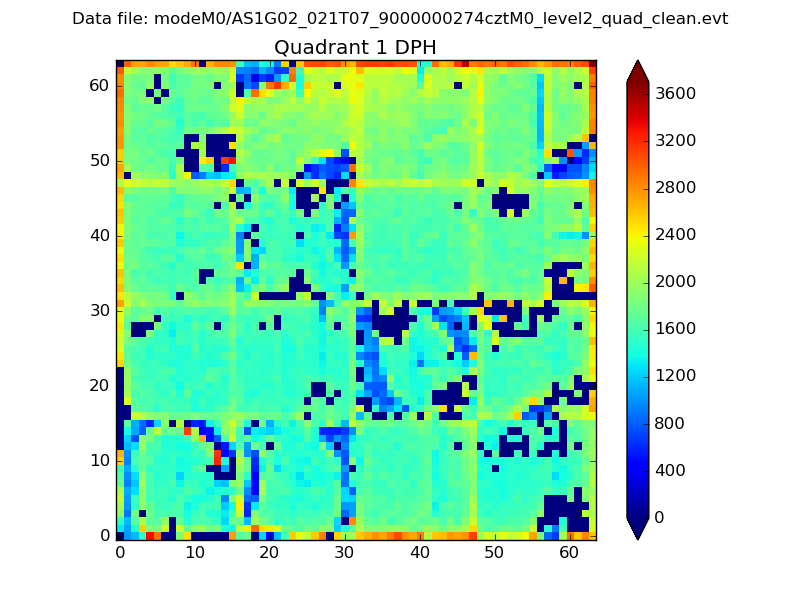
Histogram calculated using DETX and DETY for each event in the final _common_clean file
| Quadrant A |  |
 |
Quadrant B |
|---|---|---|---|
| Quadrant D |  |
 |
Quadrant C |
| Plot type | Count rate plots | Images |
|---|---|---|
| Comparison with Poisson distribution Blue bars denote a histogram of data divided into 1 sec bins. Red curve is a Poisson curve with rate = median count rate of data. |
 |
 |
| Quadrant-wise count rates Data is divided into 100 sec bins |
 |
|
| Module-wise count rates for Quadrant A Data is divided into 100 sec bins |
 |
 |
| Module-wise count rates for Quadrant B Data is divided into 100 sec bins |
 |
 |
| Module-wise count rates for Quadrant C Data is divided into 100 sec bins |
 |
 |
| Module-wise count rates for Quadrant D Data is divided into 100 sec bins |
 |
 |
| Parameter | Plot |
|---|---|
| CZT HV Monitor |  |
| D_VDD |  |
| Temperature 1 |  |
| Veto HV Monitor | 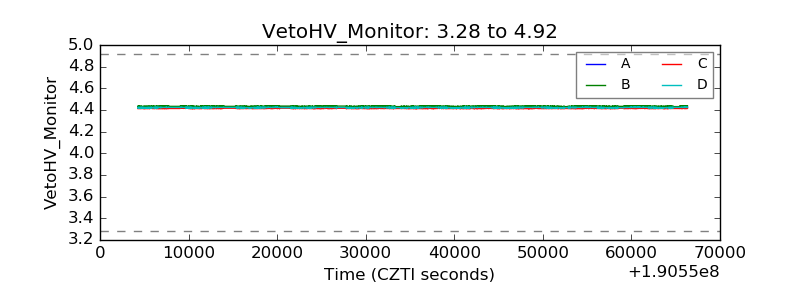 |
| Veto LLD |  |
| Alpha Counter | 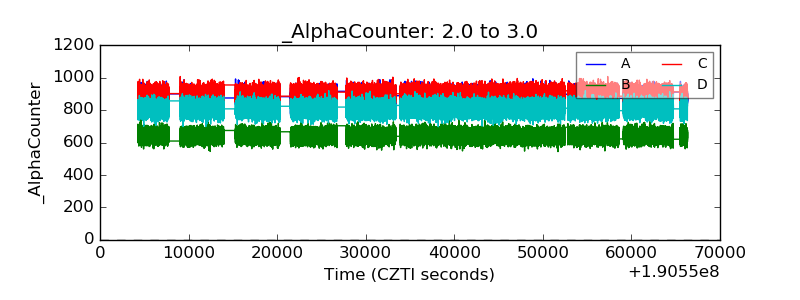 |
| _CPM_Rate | 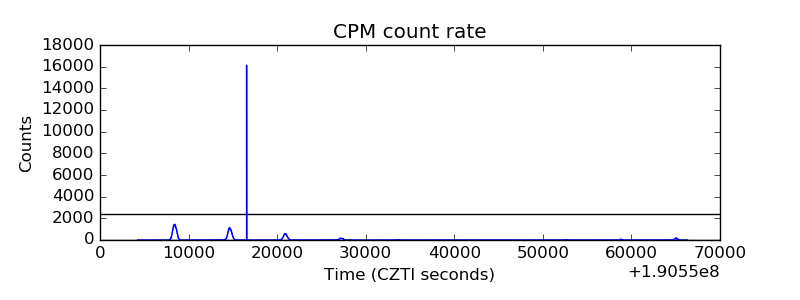 |
| CZT Counter | 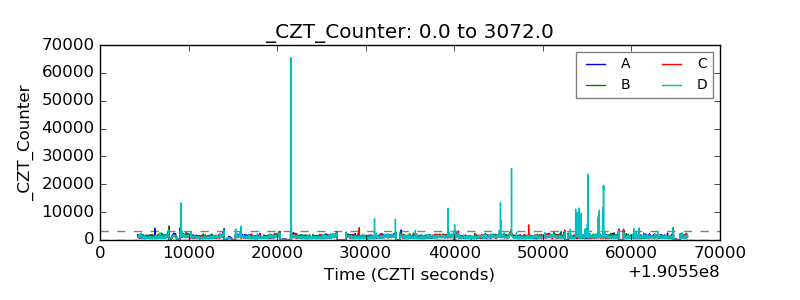 |
| +2.5 Volts monitor |  |
| +5 Volts monitor |  |
| _ROLL_ROT | 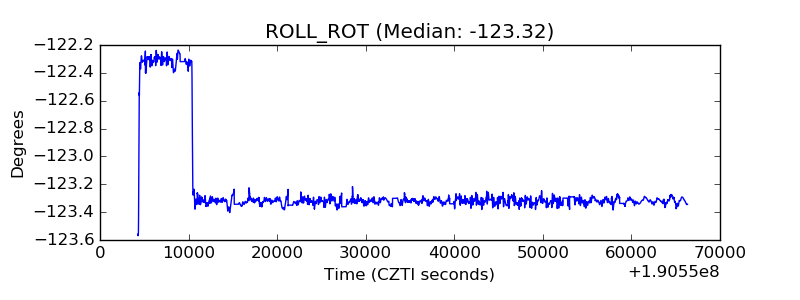 |
| _Roll_DEC |  |
| _Roll_RA | 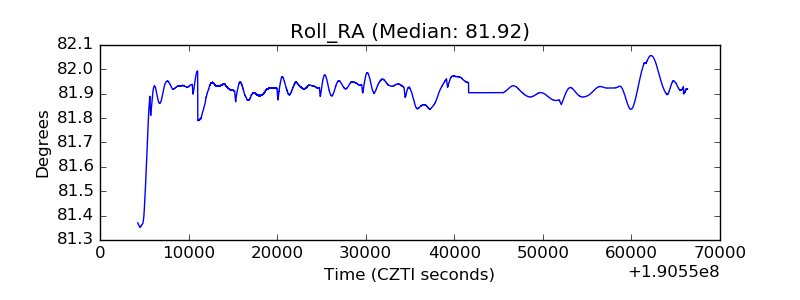 |
| Veto Counter |  |