| Param | Original file | Final file |
|---|---|---|
| Filename | modeM0/AS1G02_021T08_9000000272cztM0_level2.evt | modeM0/AS1G02_021T08_9000000272cztM0_level2_quad_clean.evt |
| Size (bytes) | 5,262,937,920 | 352,825,920 |
| Size | 4.9 GB | 336.5 MB |
| Events in quadrant A | 39,498,933 | 2,109,271 |
| Events in quadrant B | 41,939,451 | 2,156,574 |
| Events in quadrant C | 38,232,430 | 2,121,076 |
| Events in quadrant D | 37,573,093 | 2,061,502 |
| Mode SS | |||
|---|---|---|---|
| Quadrant | BADHDUFLAG | Total packets | Discarded packets |
| A | 0 | 662 | 0 |
| B | 0 | 662 | 0 |
| C | 0 | 662 | 0 |
| D | 0 | 662 | 0 |
| Mode M9 | |||
|---|---|---|---|
| Quadrant | BADHDUFLAG | Total packets | Discarded packets |
| A | 0 | 42 | 0 |
| B | 0 | 42 | 0 |
| C | 0 | 42 | 0 |
| D | 0 | 42 | 0 |
| Mode M0 | |||
|---|---|---|---|
| Quadrant | BADHDUFLAG | Total packets | Discarded packets |
| A | 0 | 140494 | 0 |
| B | 0 | 147628 | 0 |
| C | 0 | 136735 | 0 |
| D | 0 | 134940 | 0 |
| Quadrant | Total seconds | Saturated seconds | Saturation percentage |
|---|---|---|---|
| A | 32574 | 183 | 0.561798% |
| B | 32574 | 167 | 0.512679% |
| C | 32574 | 216 | 0.663106% |
| D | 32573 | 533 | 1.636325% |
Noise dominated data is calculated using 1-second bins in cleaned event files. If a bin has >2000 counts, and if more than 50% of those come from <1% of pixels, then it is considered to be noise-dominated and hence unusable.
| Quadrant | # 1 sec bins | Bins with >0 counts | Bins with >2000 counts | High rate bins dominated by noise | Noise dominated (total time) | Noise dominated (detector-on time) | Marked lightcurve |
|---|---|---|---|---|---|---|---|
| A | 53922 | 32581 | 1259 | 1259 | 2.33% | 3.86% |  |
| B | 53922 | 32583 | 1648 | 1648 | 3.06% | 5.06% |  |
| C | 53922 | 32582 | 1295 | 1295 | 2.40% | 3.97% |  |
| D | 53922 | 32581 | 1550 | 1550 | 2.87% | 4.76% |  |
Top three noisy pixels from each quadrant. If the there are fewer than three noisy pixels in the level2.evt file, extra rows are filled as -1
| Pixel properties | Quadrant properties | ||||||
|---|---|---|---|---|---|---|---|
| Quadrant | DetID | PixID | Counts | Sigma | Mean | Median | Sigma |
| A | 8 | 14 | 127214 | 47.17 | 10256 | 10335 | 2477.7 |
| A | 12 | 133 | 109841 | 40.16 | 10256 | 10335 | 2477.7 |
| A | 15 | 106 | 34463 | 9.74 | 10256 | 10335 | 2477.7 |
| B | 8 | 3 | 938060 | 370.42 | 10617 | 10671 | 2503.6 |
| B | 0 | 234 | 671301 | 263.87 | 10617 | 10671 | 2503.6 |
| B | 0 | 182 | 47809 | 14.83 | 10617 | 10671 | 2503.6 |
| C | 8 | 229 | 654655 | 240.51 | 9612 | 9952 | 2680.6 |
| C | 1 | 192 | 42788 | 12.25 | 9612 | 9952 | 2680.6 |
| C | 14 | 234 | 35103 | 9.38 | 9612 | 9952 | 2680.6 |
| D | 13 | 53 | 1031966 | 372.82 | 9568 | 9759 | 2741.9 |
| D | 13 | 105 | 564188 | 202.21 | 9568 | 9759 | 2741.9 |
| D | 2 | 221 | 133100 | 44.98 | 9568 | 9759 | 2741.9 |
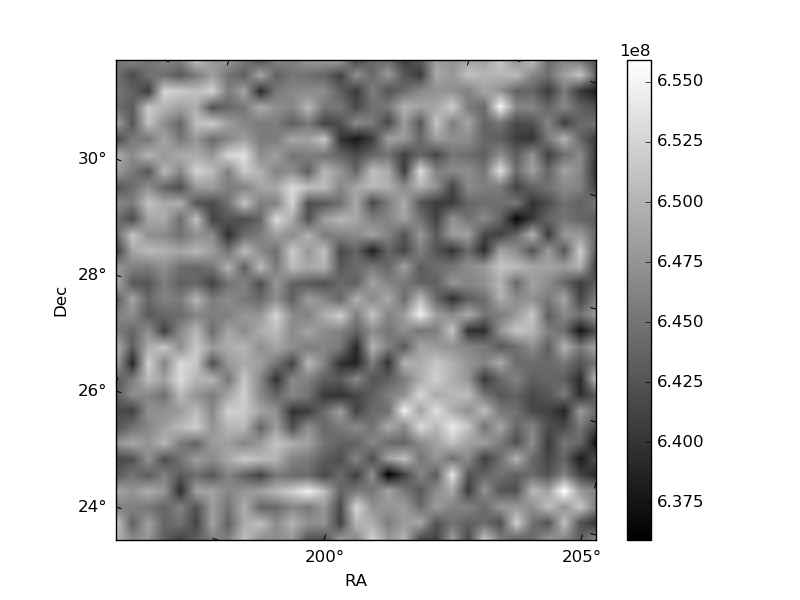
Histogram calculated using DETX and DETY for each event in the final _common_clean file
| Quadrant A |  |
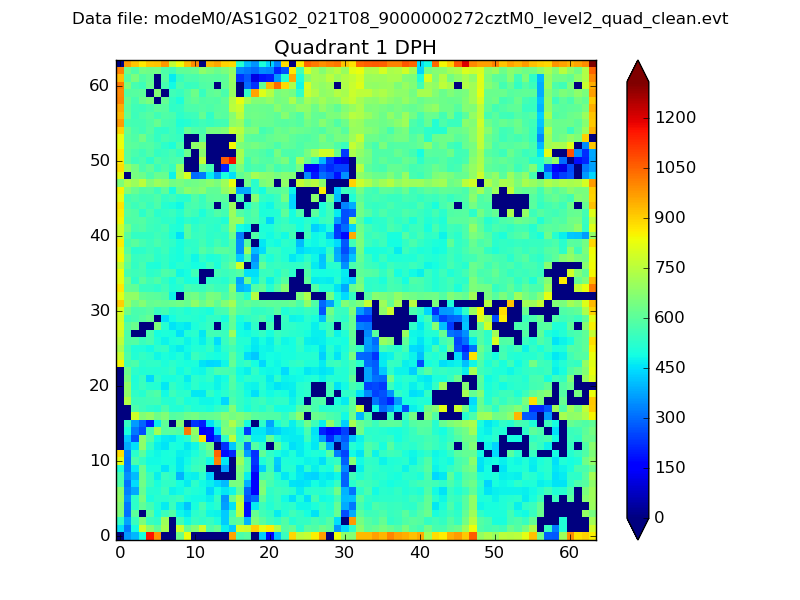 |
Quadrant B |
|---|---|---|---|
| Quadrant D |  |
 |
Quadrant C |
| Plot type | Count rate plots | Images |
|---|---|---|
| Comparison with Poisson distribution Blue bars denote a histogram of data divided into 1 sec bins. Red curve is a Poisson curve with rate = median count rate of data. |
 |
 |
| Quadrant-wise count rates Data is divided into 100 sec bins |
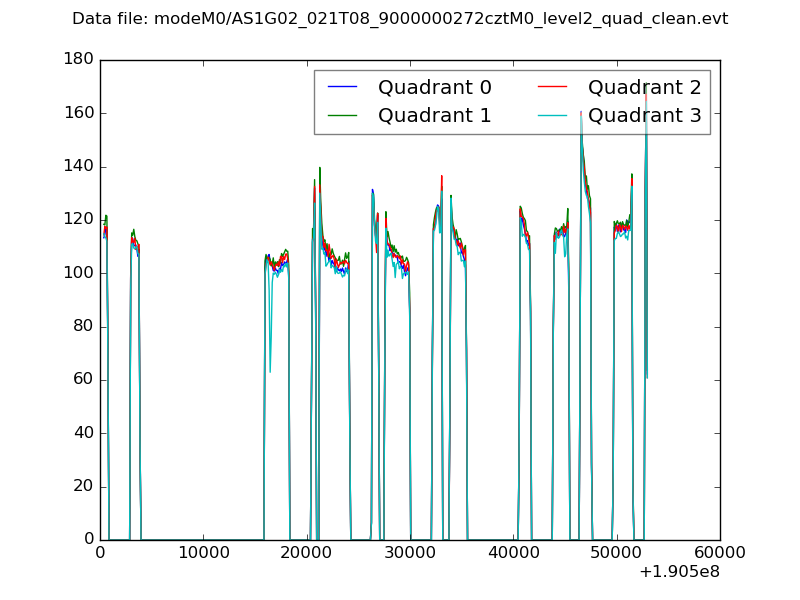 |
|
| Module-wise count rates for Quadrant A Data is divided into 100 sec bins |
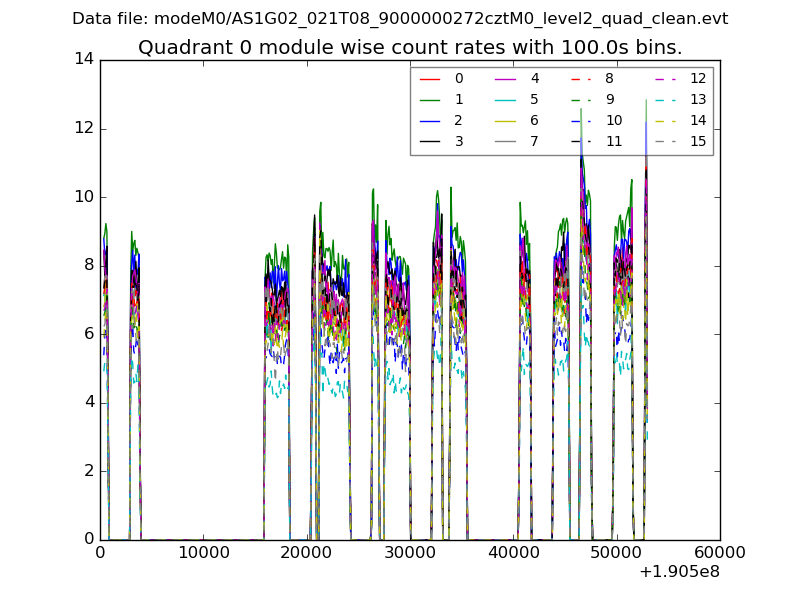 |
 |
| Module-wise count rates for Quadrant B Data is divided into 100 sec bins |
 |
 |
| Module-wise count rates for Quadrant C Data is divided into 100 sec bins |
 |
 |
| Module-wise count rates for Quadrant D Data is divided into 100 sec bins |
 |
 |
| Parameter | Plot |
|---|---|
| CZT HV Monitor | 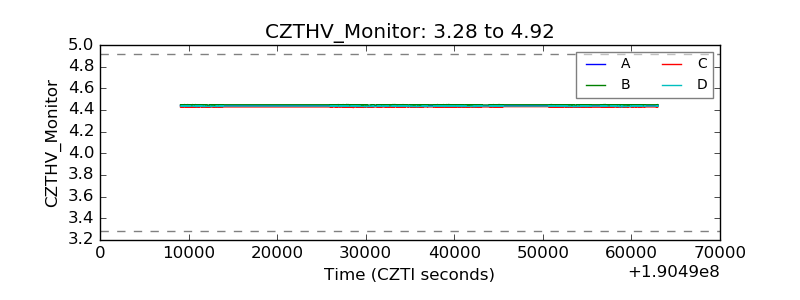 |
| D_VDD |  |
| Temperature 1 |  |
| Veto HV Monitor |  |
| Veto LLD |  |
| Alpha Counter | 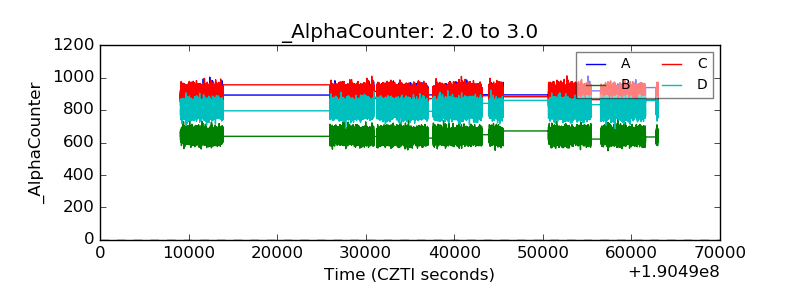 |
| _CPM_Rate |  |
| CZT Counter | 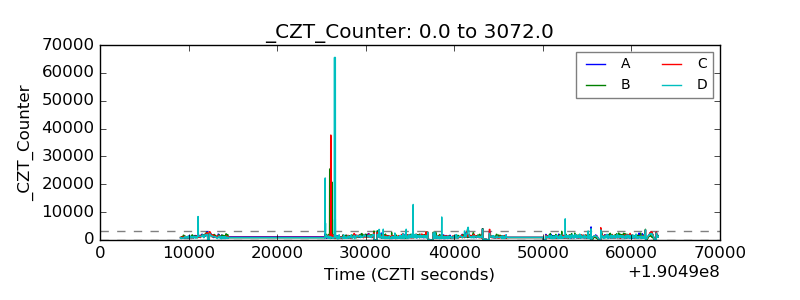 |
| +2.5 Volts monitor | 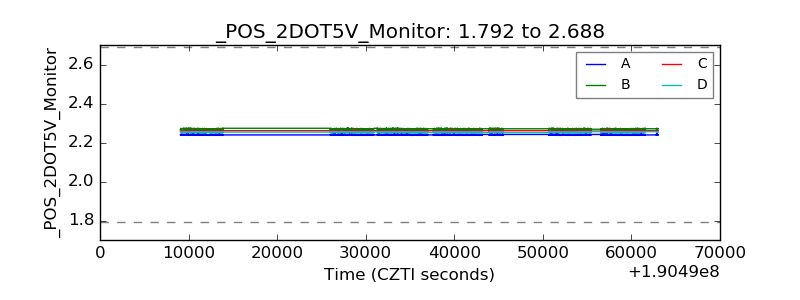 |
| +5 Volts monitor |  |
| _ROLL_ROT |  |
| _Roll_DEC |  |
| _Roll_RA |  |
| Veto Counter |  |