| Param | Original file | Final file |
|---|---|---|
| Filename | modeM0/AS1G02_025T02_9000000270cztM0_level2.evt | modeM0/AS1G02_025T02_9000000270cztM0_level2_quad_clean.evt |
| Size (bytes) | 13,602,847,680 | 1,046,715,840 |
| Size | 12.7 GB | 998.2 MB |
| Events in quadrant A | 101,878,168 | 6,542,800 |
| Events in quadrant B | 106,119,177 | 6,580,413 |
| Events in quadrant C | 98,528,304 | 6,450,319 |
| Events in quadrant D | 99,800,131 | 6,261,720 |
| Mode SS | |||
|---|---|---|---|
| Quadrant | BADHDUFLAG | Total packets | Discarded packets |
| A | 0 | 1750 | 0 |
| B | 0 | 1750 | 0 |
| C | 0 | 1750 | 0 |
| D | 0 | 1750 | 0 |
| Mode M0 | |||
|---|---|---|---|
| Quadrant | BADHDUFLAG | Total packets | Discarded packets |
| A | 0 | 363416 | 0 |
| B | 0 | 375954 | 0 |
| C | 0 | 353866 | 0 |
| D | 0 | 358055 | 0 |
| Mode M9 | |||
|---|---|---|---|
| Quadrant | BADHDUFLAG | Total packets | Discarded packets |
| A | 0 | 127 | 0 |
| B | 0 | 127 | 0 |
| C | 0 | 127 | 0 |
| D | 0 | 127 | 0 |
| Quadrant | Total seconds | Saturated seconds | Saturation percentage |
|---|---|---|---|
| A | 85599 | 599 | 0.699775% |
| B | 85599 | 580 | 0.677578% |
| C | 85599 | 499 | 0.582951% |
| D | 85599 | 2464 | 2.878538% |
Noise dominated data is calculated using 1-second bins in cleaned event files. If a bin has >2000 counts, and if more than 50% of those come from <1% of pixels, then it is considered to be noise-dominated and hence unusable.
| Quadrant | # 1 sec bins | Bins with >0 counts | Bins with >2000 counts | High rate bins dominated by noise | Noise dominated (total time) | Noise dominated (detector-on time) | Marked lightcurve |
|---|---|---|---|---|---|---|---|
| A | 104275 | 85610 | 3195 | 3195 | 3.06% | 3.73% |  |
| B | 104275 | 85611 | 3580 | 3580 | 3.43% | 4.18% | 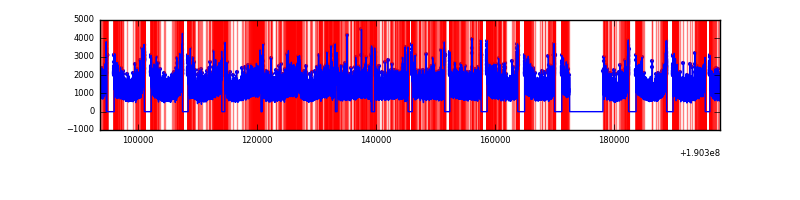 |
| C | 104275 | 85611 | 2727 | 2727 | 2.62% | 3.19% |  |
| D | 104275 | 85612 | 5266 | 5266 | 5.05% | 6.15% |  |
Top three noisy pixels from each quadrant. If the there are fewer than three noisy pixels in the level2.evt file, extra rows are filled as -1
| Pixel properties | Quadrant properties | ||||||
|---|---|---|---|---|---|---|---|
| Quadrant | DetID | PixID | Counts | Sigma | Mean | Median | Sigma |
| A | 8 | 14 | 106430 | 12.45 | 26604 | 26845 | 6392.8 |
| A | 15 | 236 | 78308 | 8.05 | 26604 | 26845 | 6392.8 |
| A | 8 | 15 | 76109 | 7.71 | 26604 | 26845 | 6392.8 |
| B | 0 | 234 | 354812 | 50.35 | 27762 | 27969 | 6491.3 |
| B | 4 | 80 | 236245 | 32.09 | 27762 | 27969 | 6491.3 |
| B | 7 | 205 | 191886 | 25.25 | 27762 | 27969 | 6491.3 |
| C | 8 | 229 | 225731 | 28.59 | 25153 | 26019 | 6984.9 |
| C | 1 | 192 | 112258 | 12.35 | 25153 | 26019 | 6984.9 |
| C | 7 | 159 | 101989 | 10.88 | 25153 | 26019 | 6984.9 |
| D | 13 | 53 | 2008000 | 275.29 | 24794 | 25220 | 7202.4 |
| D | 13 | 105 | 1656804 | 226.53 | 24794 | 25220 | 7202.4 |
| D | 10 | 84 | 1428850 | 194.88 | 24794 | 25220 | 7202.4 |
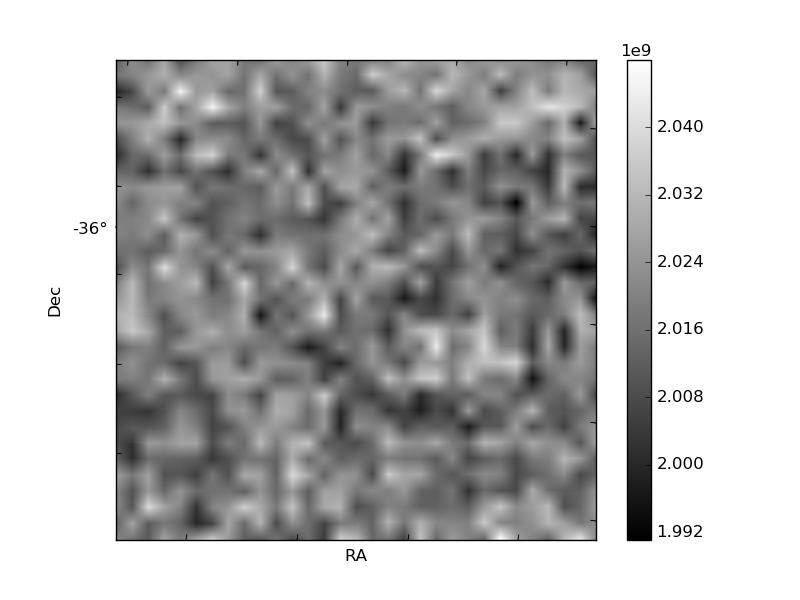
Histogram calculated using DETX and DETY for each event in the final _common_clean file
| Quadrant A |  |
 |
Quadrant B |
|---|---|---|---|
| Quadrant D |  |
 |
Quadrant C |
| Plot type | Count rate plots | Images |
|---|---|---|
| Comparison with Poisson distribution Blue bars denote a histogram of data divided into 1 sec bins. Red curve is a Poisson curve with rate = median count rate of data. |
 |
 |
| Quadrant-wise count rates Data is divided into 100 sec bins |
 |
|
| Module-wise count rates for Quadrant A Data is divided into 100 sec bins |
 |
 |
| Module-wise count rates for Quadrant B Data is divided into 100 sec bins |
 |
 |
| Module-wise count rates for Quadrant C Data is divided into 100 sec bins |
 |
 |
| Module-wise count rates for Quadrant D Data is divided into 100 sec bins |
 |
 |
| Parameter | Plot |
|---|---|
| CZT HV Monitor |  |
| D_VDD |  |
| Temperature 1 |  |
| Veto HV Monitor |  |
| Veto LLD |  |
| Alpha Counter |  |
| _CPM_Rate |  |
| CZT Counter |  |
| +2.5 Volts monitor |  |
| +5 Volts monitor |  |
| _ROLL_ROT |  |
| _Roll_DEC |  |
| _Roll_RA |  |
| Veto Counter |  |