| Param | Original file | Final file |
|---|---|---|
| Filename | modeM0/AS1G02_020T02_9000000268cztM0_level2.evt | modeM0/AS1G02_020T02_9000000268cztM0_level2_quad_clean.evt |
| Size (bytes) | 2,549,839,680 | 206,625,600 |
| Size | 2.4 GB | 197.1 MB |
| Events in quadrant A | 19,299,064 | 1,314,185 |
| Events in quadrant B | 19,603,102 | 1,319,197 |
| Events in quadrant C | 18,336,031 | 1,293,580 |
| Events in quadrant D | 18,929,016 | 1,229,064 |
| Mode M9 | |||
|---|---|---|---|
| Quadrant | BADHDUFLAG | Total packets | Discarded packets |
| A | 0 | 29 | 0 |
| B | 0 | 29 | 0 |
| C | 0 | 29 | 0 |
| D | 0 | 29 | 0 |
| Mode M0 | |||
|---|---|---|---|
| Quadrant | BADHDUFLAG | Total packets | Discarded packets |
| A | 0 | 68652 | 0 |
| B | 0 | 69532 | 0 |
| C | 0 | 65820 | 0 |
| D | 0 | 67692 | 0 |
| Mode SS | |||
|---|---|---|---|
| Quadrant | BADHDUFLAG | Total packets | Discarded packets |
| A | 0 | 326 | 0 |
| B | 0 | 326 | 0 |
| C | 0 | 326 | 0 |
| D | 0 | 326 | 0 |
| Quadrant | Total seconds | Saturated seconds | Saturation percentage |
|---|---|---|---|
| A | 15977 | 55 | 0.344245% |
| B | 15977 | 28 | 0.175252% |
| C | 15977 | 62 | 0.388058% |
| D | 15977 | 573 | 3.586405% |
Noise dominated data is calculated using 1-second bins in cleaned event files. If a bin has >2000 counts, and if more than 50% of those come from <1% of pixels, then it is considered to be noise-dominated and hence unusable.
| Quadrant | # 1 sec bins | Bins with >0 counts | Bins with >2000 counts | High rate bins dominated by noise | Noise dominated (total time) | Noise dominated (detector-on time) | Marked lightcurve |
|---|---|---|---|---|---|---|---|
| A | 30397 | 15981 | 384 | 384 | 1.26% | 2.40% |  |
| B | 30397 | 15982 | 405 | 405 | 1.33% | 2.53% | 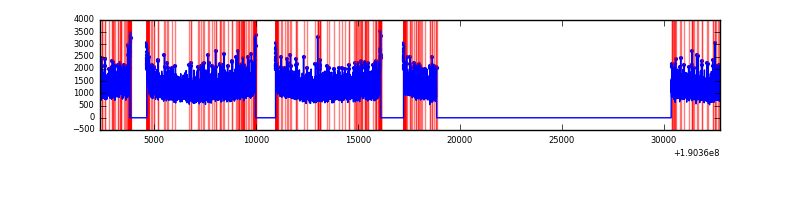 |
| C | 30397 | 15980 | 398 | 398 | 1.31% | 2.49% |  |
| D | 30397 | 15979 | 936 | 936 | 3.08% | 5.86% |  |
Top three noisy pixels from each quadrant. If the there are fewer than three noisy pixels in the level2.evt file, extra rows are filled as -1
| Pixel properties | Quadrant properties | ||||||
|---|---|---|---|---|---|---|---|
| Quadrant | DetID | PixID | Counts | Sigma | Mean | Median | Sigma |
| A | 8 | 14 | 91961 | 72.79 | 5003 | 5030 | 1194.2 |
| A | 8 | 15 | 43683 | 32.37 | 5003 | 5030 | 1194.2 |
| A | 10 | 2 | 25852 | 17.44 | 5003 | 5030 | 1194.2 |
| B | 0 | 234 | 50360 | 37.27 | 5136 | 5154 | 1212.8 |
| B | 0 | 220 | 47391 | 34.83 | 5136 | 5154 | 1212.8 |
| B | 4 | 200 | 41771 | 30.19 | 5136 | 5154 | 1212.8 |
| C | 8 | 229 | 209341 | 159.58 | 4636 | 4797 | 1281.8 |
| C | 7 | 159 | 18042 | 10.33 | 4636 | 4797 | 1281.8 |
| C | 12 | 4 | 17478 | 9.89 | 4636 | 4797 | 1281.8 |
| D | 10 | 84 | 1286233 | 967.52 | 4502 | 4648 | 1324.6 |
| D | 13 | 105 | 449281 | 335.67 | 4502 | 4648 | 1324.6 |
| D | 13 | 53 | 308672 | 229.52 | 4502 | 4648 | 1324.6 |
Histogram calculated using DETX and DETY for each event in the final _common_clean file
| Quadrant A |  |
 |
Quadrant B |
|---|---|---|---|
| Quadrant D |  |
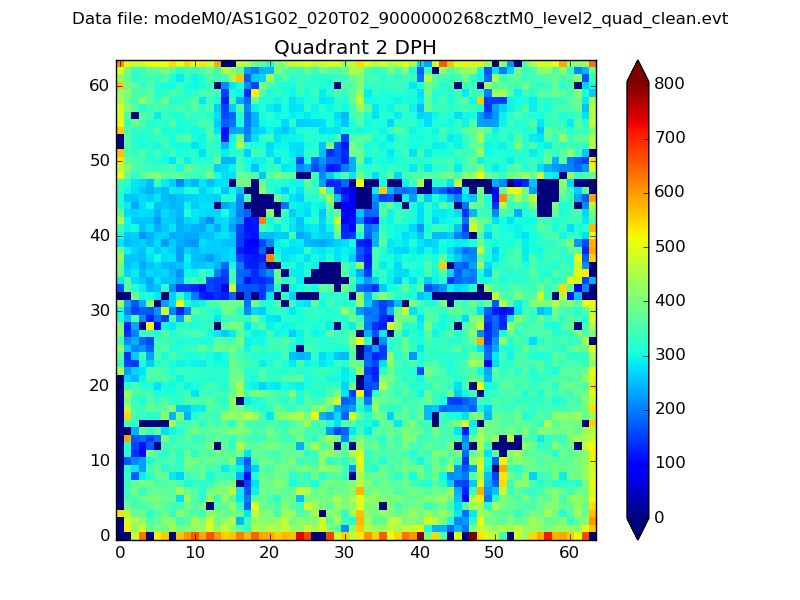 |
Quadrant C |
| Plot type | Count rate plots | Images |
|---|---|---|
| Comparison with Poisson distribution Blue bars denote a histogram of data divided into 1 sec bins. Red curve is a Poisson curve with rate = median count rate of data. |
 |
 |
| Quadrant-wise count rates Data is divided into 100 sec bins |
 |
|
| Module-wise count rates for Quadrant A Data is divided into 100 sec bins |
 |
 |
| Module-wise count rates for Quadrant B Data is divided into 100 sec bins |
 |
 |
| Module-wise count rates for Quadrant C Data is divided into 100 sec bins |
 |
 |
| Module-wise count rates for Quadrant D Data is divided into 100 sec bins |
 |
 |
| Parameter | Plot |
|---|---|
| CZT HV Monitor |  |
| D_VDD |  |
| Temperature 1 |  |
| Veto HV Monitor | 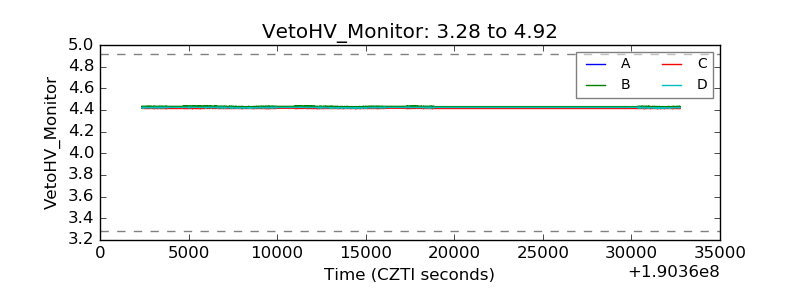 |
| Veto LLD |  |
| Alpha Counter |  |
| _CPM_Rate |  |
| CZT Counter |  |
| +2.5 Volts monitor |  |
| +5 Volts monitor |  |
| _ROLL_ROT |  |
| _Roll_DEC |  |
| _Roll_RA |  |
| Veto Counter |  |