| Param | Original file | Final file |
|---|---|---|
| Filename | modeM0/AS1G02_026T02_9000000266cztM0_level2.evt | modeM0/AS1G02_026T02_9000000266cztM0_level2_quad_clean.evt |
| Size (bytes) | 6,927,860,160 | 508,466,880 |
| Size | 6.5 GB | 484.9 MB |
| Events in quadrant A | 51,558,461 | 3,140,694 |
| Events in quadrant B | 53,221,104 | 3,207,679 |
| Events in quadrant C | 50,174,335 | 3,095,773 |
| Events in quadrant D | 52,018,883 | 2,997,212 |
| Mode M9 | |||
|---|---|---|---|
| Quadrant | BADHDUFLAG | Total packets | Discarded packets |
| A | 0 | 36 | 0 |
| B | 0 | 36 | 0 |
| C | 0 | 36 | 0 |
| D | 0 | 36 | 0 |
| Mode SS | |||
|---|---|---|---|
| Quadrant | BADHDUFLAG | Total packets | Discarded packets |
| A | 0 | 874 | 0 |
| B | 0 | 874 | 0 |
| C | 0 | 874 | 0 |
| D | 0 | 874 | 0 |
| Mode M0 | |||
|---|---|---|---|
| Quadrant | BADHDUFLAG | Total packets | Discarded packets |
| A | 0 | 183840 | 0 |
| B | 0 | 188635 | 0 |
| C | 0 | 179786 | 0 |
| D | 0 | 185397 | 0 |
| Quadrant | Total seconds | Saturated seconds | Saturation percentage |
|---|---|---|---|
| A | 43118 | 156 | 0.361798% |
| B | 43118 | 147 | 0.340925% |
| C | 43118 | 139 | 0.322371% |
| D | 43118 | 635 | 1.472703% |
Noise dominated data is calculated using 1-second bins in cleaned event files. If a bin has >2000 counts, and if more than 50% of those come from <1% of pixels, then it is considered to be noise-dominated and hence unusable.
| Quadrant | # 1 sec bins | Bins with >0 counts | Bins with >2000 counts | High rate bins dominated by noise | Noise dominated (total time) | Noise dominated (detector-on time) | Marked lightcurve |
|---|---|---|---|---|---|---|---|
| A | 46603 | 43124 | 1604 | 1604 | 3.44% | 3.72% |  |
| B | 46603 | 43124 | 1749 | 1749 | 3.75% | 4.06% |  |
| C | 46603 | 43122 | 1470 | 1470 | 3.15% | 3.41% |  |
| D | 46603 | 43125 | 3115 | 3115 | 6.68% | 7.22% |  |
Top three noisy pixels from each quadrant. If the there are fewer than three noisy pixels in the level2.evt file, extra rows are filled as -1
| Pixel properties | Quadrant properties | ||||||
|---|---|---|---|---|---|---|---|
| Quadrant | DetID | PixID | Counts | Sigma | Mean | Median | Sigma |
| A | 8 | 14 | 139761 | 39.25 | 13422 | 13554 | 3215.5 |
| A | 8 | 15 | 70488 | 17.71 | 13422 | 13554 | 3215.5 |
| A | 12 | 251 | 49838 | 11.28 | 13422 | 13554 | 3215.5 |
| B | 4 | 80 | 123645 | 33.61 | 13951 | 14074 | 3260.5 |
| B | 0 | 220 | 107159 | 28.55 | 13951 | 14074 | 3260.5 |
| B | 0 | 234 | 90378 | 23.4 | 13951 | 14074 | 3260.5 |
| C | 8 | 229 | 434452 | 119.71 | 12657 | 13112 | 3519.6 |
| C | 9 | 68 | 270258 | 73.06 | 12657 | 13112 | 3519.6 |
| C | 1 | 192 | 62850 | 14.13 | 12657 | 13112 | 3519.6 |
| D | 13 | 138 | 1780289 | 490.86 | 12614 | 12846 | 3600.7 |
| D | 10 | 84 | 1632169 | 449.73 | 12614 | 12846 | 3600.7 |
| D | 13 | 53 | 804927 | 219.98 | 12614 | 12846 | 3600.7 |
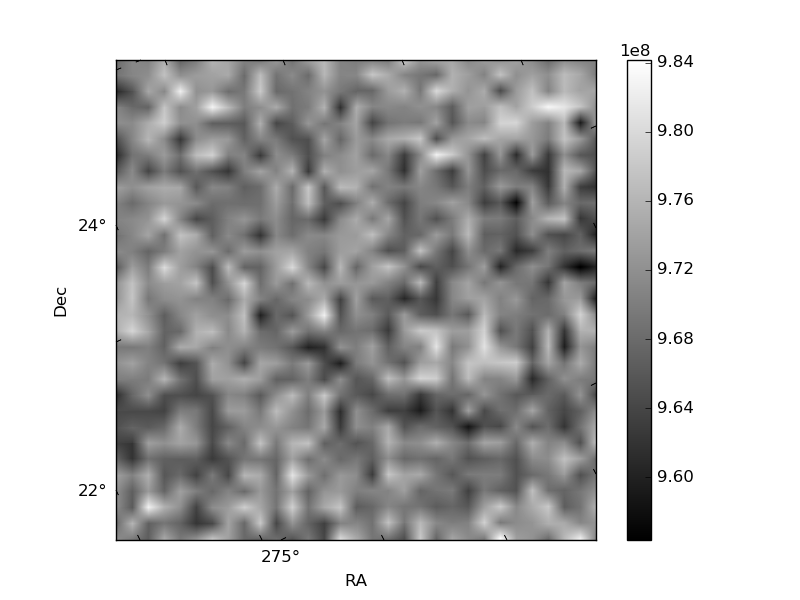
Histogram calculated using DETX and DETY for each event in the final _common_clean file
| Quadrant A |  |
 |
Quadrant B |
|---|---|---|---|
| Quadrant D |  |
 |
Quadrant C |
| Plot type | Count rate plots | Images |
|---|---|---|
| Comparison with Poisson distribution Blue bars denote a histogram of data divided into 1 sec bins. Red curve is a Poisson curve with rate = median count rate of data. |
 |
 |
| Quadrant-wise count rates Data is divided into 100 sec bins |
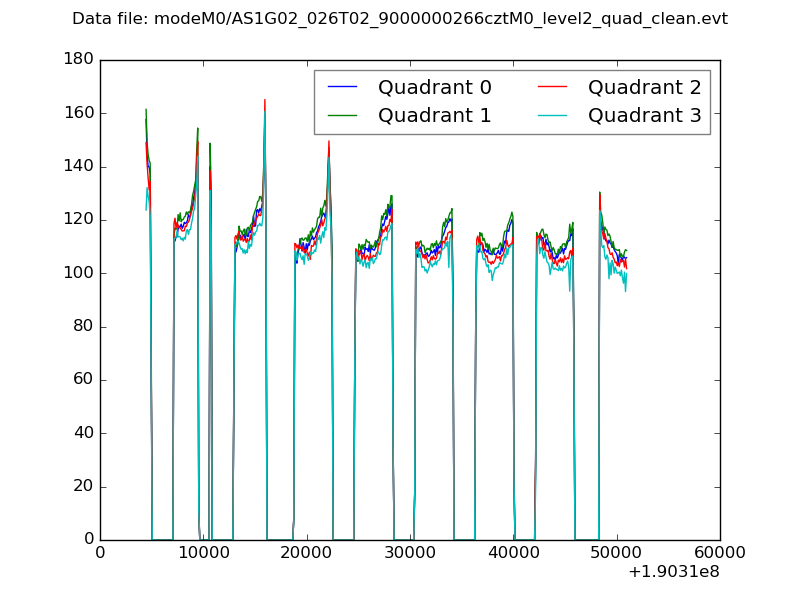 |
|
| Module-wise count rates for Quadrant A Data is divided into 100 sec bins |
 |
 |
| Module-wise count rates for Quadrant B Data is divided into 100 sec bins |
 |
 |
| Module-wise count rates for Quadrant C Data is divided into 100 sec bins |
 |
 |
| Module-wise count rates for Quadrant D Data is divided into 100 sec bins |
 |
 |
| Parameter | Plot |
|---|---|
| CZT HV Monitor |  |
| D_VDD |  |
| Temperature 1 |  |
| Veto HV Monitor |  |
| Veto LLD |  |
| Alpha Counter |  |
| _CPM_Rate |  |
| CZT Counter |  |
| +2.5 Volts monitor |  |
| +5 Volts monitor |  |
| _ROLL_ROT | 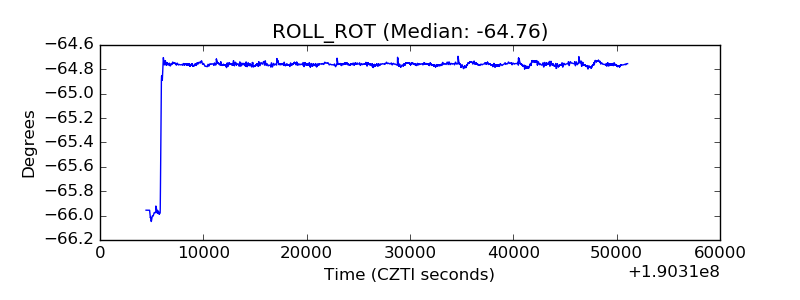 |
| _Roll_DEC |  |
| _Roll_RA |  |
| Veto Counter |  |