| Param | Original file | Final file |
|---|---|---|
| Filename | modeM0/AS1G02_019T04_9000000262cztM0_level2.evt | modeM0/AS1G02_019T04_9000000262cztM0_level2_quad_clean.evt |
| Size (bytes) | 2,896,580,160 | 190,944,000 |
| Size | 2.7 GB | 182.1 MB |
| Events in quadrant A | 21,787,684 | 1,138,260 |
| Events in quadrant B | 22,398,887 | 1,162,220 |
| Events in quadrant C | 21,058,876 | 1,141,522 |
| Events in quadrant D | 21,295,785 | 1,106,058 |
| Mode M9 | |||
|---|---|---|---|
| Quadrant | BADHDUFLAG | Total packets | Discarded packets |
| A | 0 | 26 | 0 |
| B | 0 | 26 | 0 |
| C | 0 | 26 | 0 |
| D | 0 | 26 | 0 |
| Mode SS | |||
|---|---|---|---|
| Quadrant | BADHDUFLAG | Total packets | Discarded packets |
| A | 0 | 372 | 0 |
| B | 0 | 384 | 0 |
| C | 0 | 378 | 0 |
| D | 0 | 370 | 0 |
| Mode M0 | |||
|---|---|---|---|
| Quadrant | BADHDUFLAG | Total packets | Discarded packets |
| A | 0 | 77430 | 0 |
| B | 0 | 79184 | 0 |
| C | 0 | 75247 | 0 |
| D | 0 | 76038 | 0 |
| Quadrant | Total seconds | Saturated seconds | Saturation percentage |
|---|---|---|---|
| A | 17865 | 121 | 0.677302% |
| B | 17864 | 92 | 0.515002% |
| C | 17868 | 102 | 0.570853% |
| D | 17892 | 286 | 1.598480% |
Noise dominated data is calculated using 1-second bins in cleaned event files. If a bin has >2000 counts, and if more than 50% of those come from <1% of pixels, then it is considered to be noise-dominated and hence unusable.
| Quadrant | # 1 sec bins | Bins with >0 counts | Bins with >2000 counts | High rate bins dominated by noise | Noise dominated (total time) | Noise dominated (detector-on time) | Marked lightcurve |
|---|---|---|---|---|---|---|---|
| A | 36010 | 18182 | 592 | 592 | 1.64% | 3.26% |  |
| B | 36010 | 18191 | 649 | 649 | 1.80% | 3.57% | 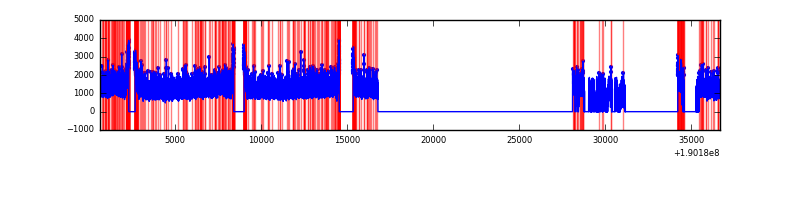 |
| C | 36010 | 18187 | 534 | 534 | 1.48% | 2.94% |  |
| D | 36010 | 18225 | 902 | 902 | 2.50% | 4.95% |  |
Top three noisy pixels from each quadrant. If the there are fewer than three noisy pixels in the level2.evt file, extra rows are filled as -1
| Pixel properties | Quadrant properties | ||||||
|---|---|---|---|---|---|---|---|
| Quadrant | DetID | PixID | Counts | Sigma | Mean | Median | Sigma |
| A | 10 | 2 | 25495 | 14.42 | 5686 | 5720 | 1371.3 |
| A | 12 | 251 | 22515 | 12.25 | 5686 | 5720 | 1371.3 |
| A | 13 | 9 | 13444 | 5.63 | 5686 | 5720 | 1371.3 |
| B | 0 | 220 | 55628 | 35.67 | 5893 | 5916 | 1393.5 |
| B | 4 | 170 | 24375 | 13.25 | 5893 | 5916 | 1393.5 |
| B | 4 | 216 | 19741 | 9.92 | 5893 | 5916 | 1393.5 |
| C | 14 | 223 | 217142 | 142.32 | 5325 | 5509 | 1487.1 |
| C | 8 | 208 | 50249 | 30.09 | 5325 | 5509 | 1487.1 |
| C | 7 | 159 | 22246 | 11.26 | 5325 | 5509 | 1487.1 |
| D | 13 | 105 | 1005758 | 625.9 | 5209 | 5401 | 1598.3 |
| D | 10 | 84 | 322235 | 198.24 | 5209 | 5401 | 1598.3 |
| D | 13 | 169 | 170823 | 103.5 | 5209 | 5401 | 1598.3 |
Histogram calculated using DETX and DETY for each event in the final _common_clean file
| Quadrant A |  |
 |
Quadrant B |
|---|---|---|---|
| Quadrant D |  |
 |
Quadrant C |
| Plot type | Count rate plots | Images |
|---|---|---|
| Comparison with Poisson distribution Blue bars denote a histogram of data divided into 1 sec bins. Red curve is a Poisson curve with rate = median count rate of data. |
 |
 |
| Quadrant-wise count rates Data is divided into 100 sec bins |
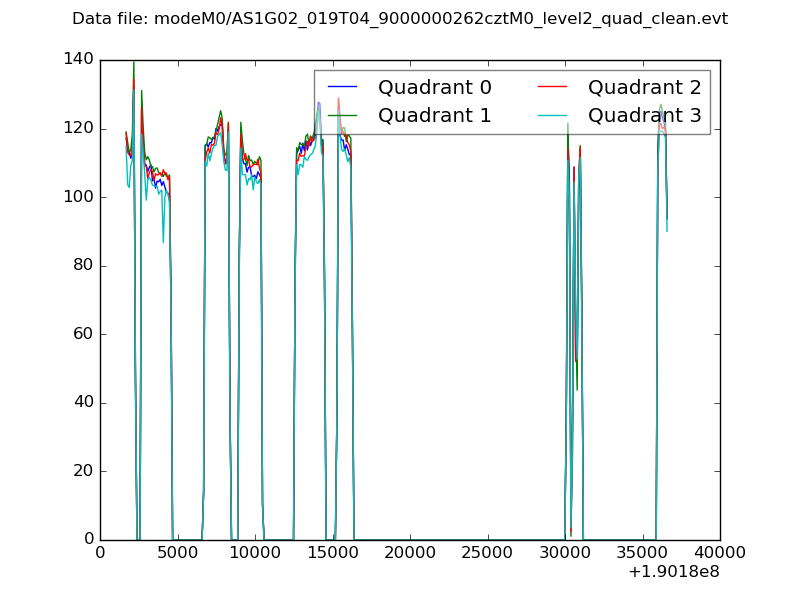 |
|
| Module-wise count rates for Quadrant A Data is divided into 100 sec bins |
 |
 |
| Module-wise count rates for Quadrant B Data is divided into 100 sec bins |
 |
 |
| Module-wise count rates for Quadrant C Data is divided into 100 sec bins |
 |
 |
| Module-wise count rates for Quadrant D Data is divided into 100 sec bins |
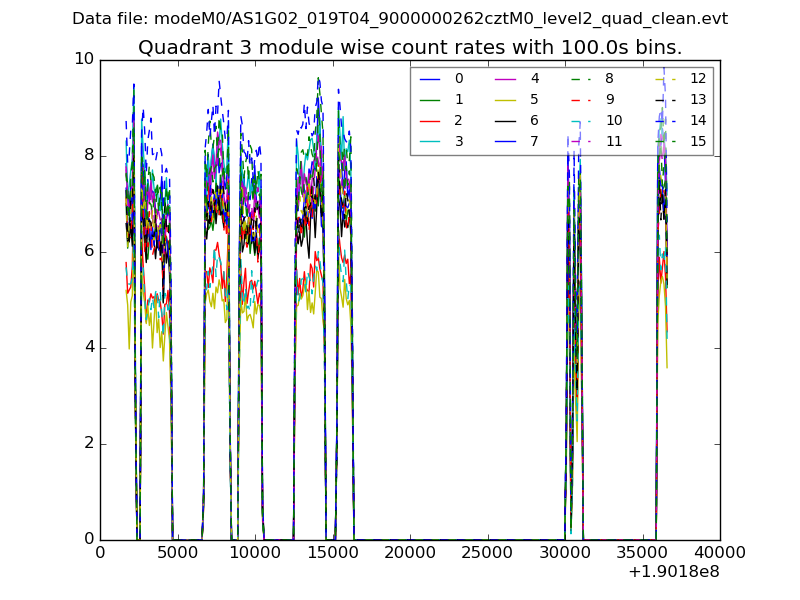 |
 |
| Parameter | Plot |
|---|---|
| CZT HV Monitor | 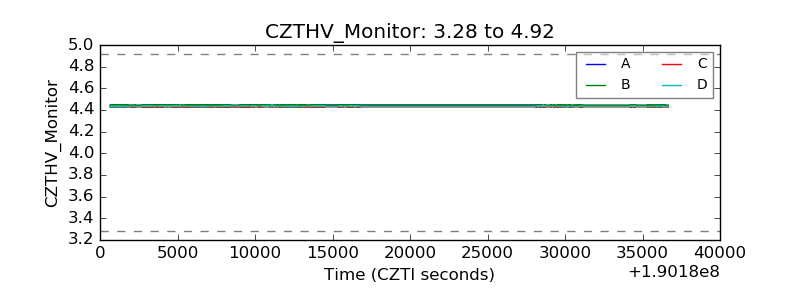 |
| D_VDD |  |
| Temperature 1 |  |
| Veto HV Monitor | 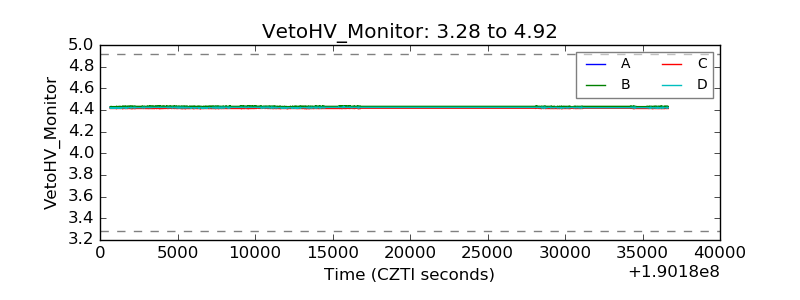 |
| Veto LLD |  |
| Alpha Counter |  |
| _CPM_Rate |  |
| CZT Counter |  |
| +2.5 Volts monitor | 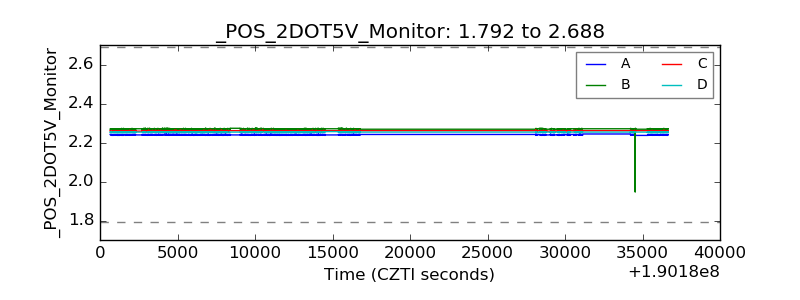 |
| +5 Volts monitor |  |
| _ROLL_ROT |  |
| _Roll_DEC |  |
| _Roll_RA |  |
| Veto Counter |  |