| Param | Original file | Final file |
|---|---|---|
| Filename | modeM0/AS1G02_019T01_9000000264cztM0_level2.evt | modeM0/AS1G02_019T01_9000000264cztM0_level2_quad_clean.evt |
| Size (bytes) | 619,358,400 | 43,064,640 |
| Size | 590.7 MB | 41.1 MB |
| Events in quadrant A | 4,502,170 | 263,701 |
| Events in quadrant B | 4,650,665 | 269,918 |
| Events in quadrant C | 4,378,370 | 267,101 |
| Events in quadrant D | 4,990,109 | 251,983 |
| Mode M9 | |||
|---|---|---|---|
| Quadrant | BADHDUFLAG | Total packets | Discarded packets |
| A | 0 | 12 | 0 |
| B | 0 | 12 | 0 |
| C | 0 | 12 | 0 |
| D | 0 | 12 | 0 |
| Mode SS | |||
|---|---|---|---|
| Quadrant | BADHDUFLAG | Total packets | Discarded packets |
| A | 0 | 74 | 0 |
| B | 0 | 74 | 0 |
| C | 0 | 74 | 0 |
| D | 0 | 74 | 0 |
| Mode M0 | |||
|---|---|---|---|
| Quadrant | BADHDUFLAG | Total packets | Discarded packets |
| A | 0 | 15877 | 2 |
| B | 0 | 16326 | 1 |
| C | 0 | 15545 | 1 |
| D | 0 | 17399 | 1 |
| Quadrant | Total seconds | Saturated seconds | Saturation percentage |
|---|---|---|---|
| A | 3540 | 63 | 1.779661% |
| B | 3540 | 54 | 1.525424% |
| C | 3540 | 54 | 1.525424% |
| D | 3540 | 242 | 6.836158% |
Noise dominated data is calculated using 1-second bins in cleaned event files. If a bin has >2000 counts, and if more than 50% of those come from <1% of pixels, then it is considered to be noise-dominated and hence unusable.
| Quadrant | # 1 sec bins | Bins with >0 counts | Bins with >2000 counts | High rate bins dominated by noise | Noise dominated (total time) | Noise dominated (detector-on time) | Marked lightcurve |
|---|---|---|---|---|---|---|---|
| A | 4795 | 3540 | 193 | 193 | 4.03% | 5.45% |  |
| B | 4795 | 3540 | 210 | 210 | 4.38% | 5.93% |  |
| C | 4795 | 3540 | 154 | 154 | 3.21% | 4.35% |  |
| D | 4795 | 3540 | 549 | 549 | 11.45% | 15.51% |  |
Top three noisy pixels from each quadrant. If the there are fewer than three noisy pixels in the level2.evt file, extra rows are filled as -1
| Pixel properties | Quadrant properties | ||||||
|---|---|---|---|---|---|---|---|
| Quadrant | DetID | PixID | Counts | Sigma | Mean | Median | Sigma |
| A | 10 | 2 | 5098 | 13.75 | 1174 | 1181 | 284.9 |
| A | 13 | 9 | 4797 | 12.69 | 1174 | 1181 | 284.9 |
| A | 15 | 236 | 4255 | 10.79 | 1174 | 1181 | 284.9 |
| B | 0 | 190 | 35575 | 121.59 | 1213 | 1219 | 282.6 |
| B | 0 | 220 | 14136 | 45.72 | 1213 | 1219 | 282.6 |
| B | 4 | 170 | 7006 | 20.48 | 1213 | 1219 | 282.6 |
| C | 10 | 34 | 6774 | 18.06 | 1118 | 1156 | 311.1 |
| C | 8 | 208 | 5021 | 12.42 | 1118 | 1156 | 311.1 |
| C | 8 | 229 | 3678 | 8.11 | 1118 | 1156 | 311.1 |
| D | 10 | 84 | 702967 | 2247.35 | 1080 | 1094 | 312.3 |
| D | 7 | 85 | 91798 | 290.43 | 1080 | 1094 | 312.3 |
| D | 13 | 169 | 60738 | 190.98 | 1080 | 1094 | 312.3 |
Histogram calculated using DETX and DETY for each event in the final _common_clean file
| Quadrant A | 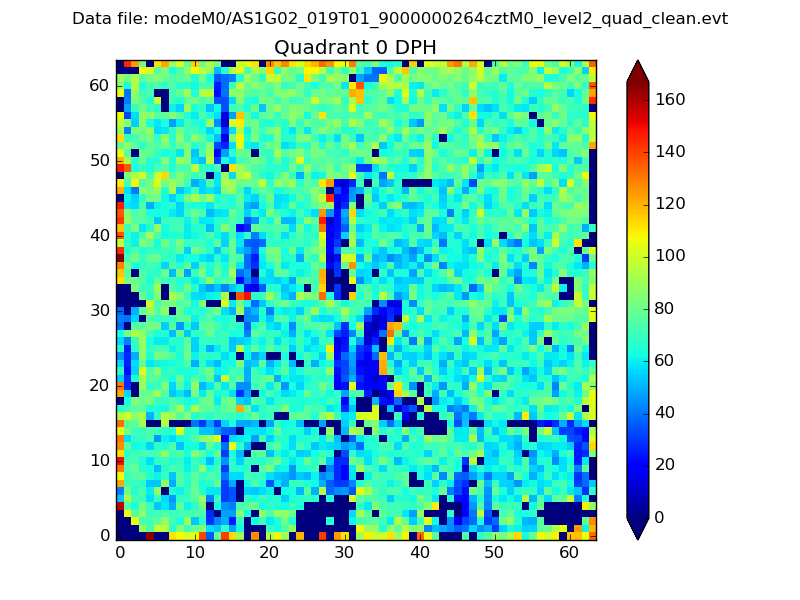 |
 |
Quadrant B |
|---|---|---|---|
| Quadrant D | 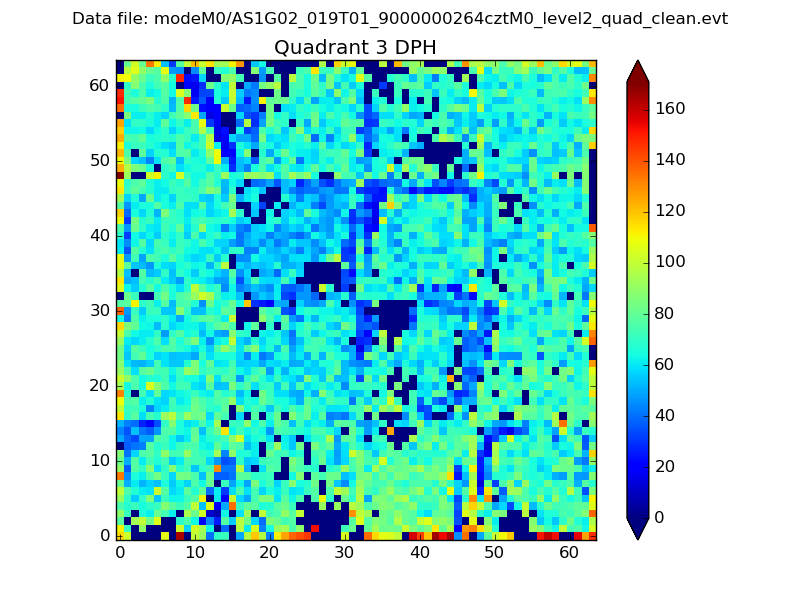 |
 |
Quadrant C |
| Plot type | Count rate plots | Images |
|---|---|---|
| Comparison with Poisson distribution Blue bars denote a histogram of data divided into 1 sec bins. Red curve is a Poisson curve with rate = median count rate of data. |
 |
 |
| Quadrant-wise count rates Data is divided into 100 sec bins |
 |
|
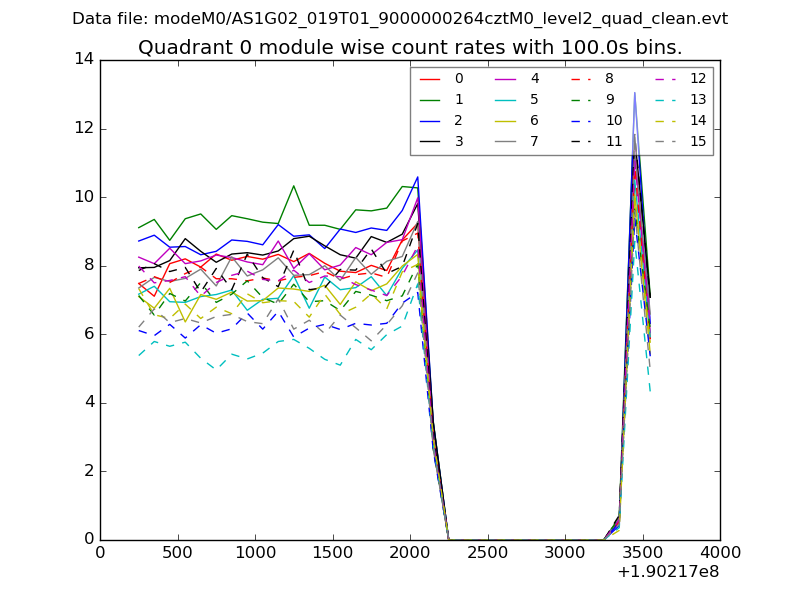
| Module-wise count rates for Quadrant A Data is divided into 100 sec bins |
 |
 |
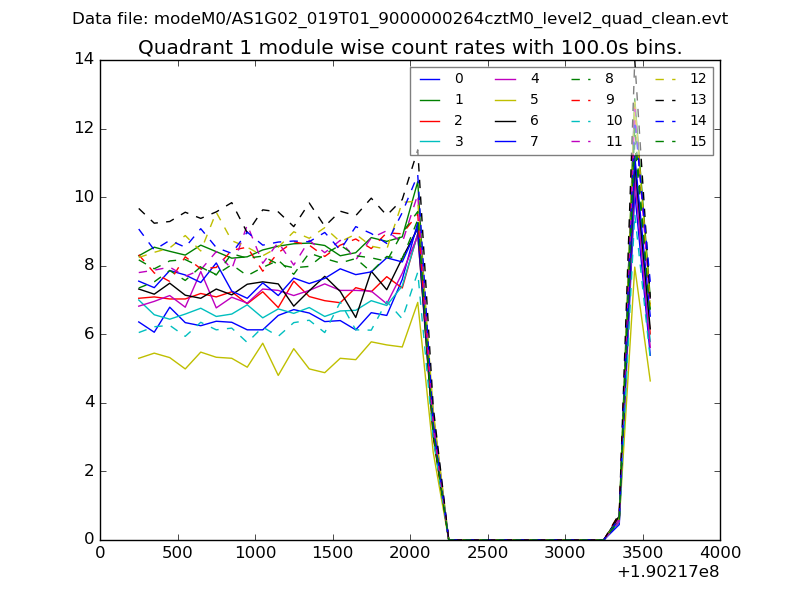
| Module-wise count rates for Quadrant B Data is divided into 100 sec bins |
 |
 |
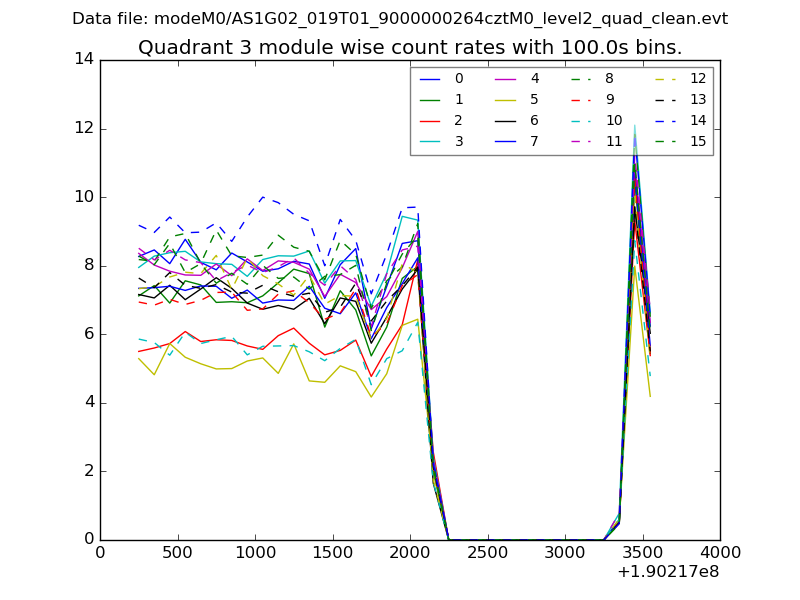
| Module-wise count rates for Quadrant C Data is divided into 100 sec bins |
 |
 |
| Module-wise count rates for Quadrant D Data is divided into 100 sec bins |
 |
 |
| Parameter | Plot |
|---|---|
| CZT HV Monitor |  |
| D_VDD |  |
| Temperature 1 | 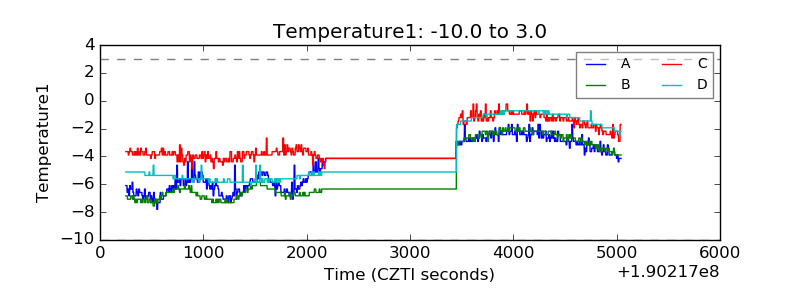 |
| Veto HV Monitor |  |
| Veto LLD |  |
| Alpha Counter |  |
| _CPM_Rate |  |
| CZT Counter |  |
| +2.5 Volts monitor |  |
| +5 Volts monitor |  |
| _ROLL_ROT |  |
| _Roll_DEC |  |
| _Roll_RA | 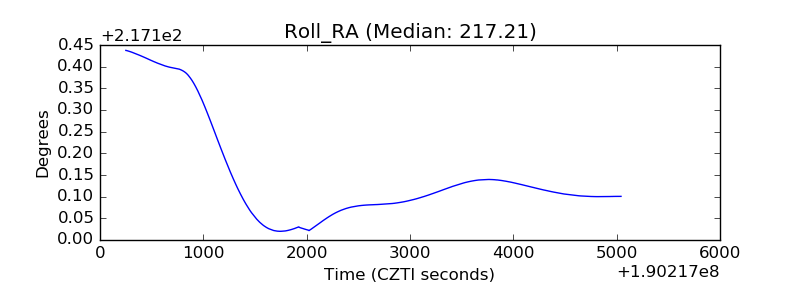 |
| Veto Counter |  |