| Param | Original file | Final file |
|---|---|---|
| Filename | modeM0/AS1G02_020T01_9000000260cztM0_level2.evt | modeM0/AS1G02_020T01_9000000260cztM0_level2_quad_clean.evt |
| Size (bytes) | 14,798,750,400 | 1,198,166,400 |
| Size | 13.8 GB | 1.1 GB |
| Events in quadrant A | 111,099,908 | 7,613,508 |
| Events in quadrant B | 111,200,809 | 7,783,328 |
| Events in quadrant C | 104,551,498 | 7,568,129 |
| Events in quadrant D | 115,424,922 | 7,172,849 |
| Mode SS | |||
|---|---|---|---|
| Quadrant | BADHDUFLAG | Total packets | Discarded packets |
| A | 0 | 1824 | 0 |
| B | 0 | 1824 | 0 |
| C | 0 | 1824 | 0 |
| D | 0 | 1824 | 0 |
| Mode M0 | |||
|---|---|---|---|
| Quadrant | BADHDUFLAG | Total packets | Discarded packets |
| A | 0 | 394018 | 0 |
| B | 0 | 394185 | 0 |
| C | 0 | 374476 | 0 |
| D | 0 | 407613 | 0 |
| Mode M9 | |||
|---|---|---|---|
| Quadrant | BADHDUFLAG | Total packets | Discarded packets |
| A | 0 | 109 | 0 |
| B | 0 | 109 | 0 |
| C | 0 | 109 | 0 |
| D | 0 | 110 | 0 |
| Quadrant | Total seconds | Saturated seconds | Saturation percentage |
|---|---|---|---|
| A | 89767 | 1572 | 1.751200% |
| B | 89763 | 344 | 0.383231% |
| C | 89767 | 523 | 0.582619% |
| D | 89767 | 5474 | 6.098009% |
Noise dominated data is calculated using 1-second bins in cleaned event files. If a bin has >2000 counts, and if more than 50% of those come from <1% of pixels, then it is considered to be noise-dominated and hence unusable.
| Quadrant | # 1 sec bins | Bins with >0 counts | Bins with >2000 counts | High rate bins dominated by noise | Noise dominated (total time) | Noise dominated (detector-on time) | Marked lightcurve |
|---|---|---|---|---|---|---|---|
| A | 127352 | 89782 | 5148 | 5148 | 4.04% | 5.73% |  |
| B | 127352 | 89784 | 3741 | 3741 | 2.94% | 4.17% |  |
| C | 127352 | 89785 | 3288 | 3288 | 2.58% | 3.66% |  |
| D | 127352 | 89785 | 9909 | 9909 | 7.78% | 11.04% | 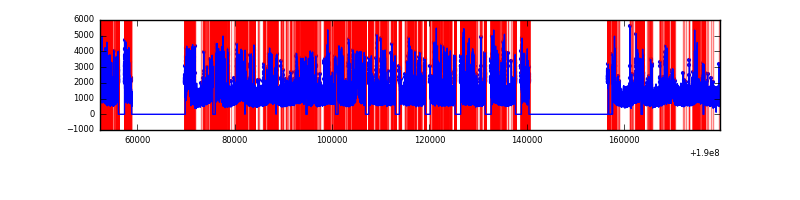 |
Top three noisy pixels from each quadrant. If the there are fewer than three noisy pixels in the level2.evt file, extra rows are filled as -1
| Pixel properties | Quadrant properties | ||||||
|---|---|---|---|---|---|---|---|
| Quadrant | DetID | PixID | Counts | Sigma | Mean | Median | Sigma |
| A | 14 | 5 | 4704026 | 707.68 | 27588 | 27697 | 6608.0 |
| A | 15 | 106 | 279963 | 38.18 | 27588 | 27697 | 6608.0 |
| A | 8 | 14 | 232227 | 30.95 | 27588 | 27697 | 6608.0 |
| B | 0 | 220 | 687731 | 96.9 | 28961 | 29052 | 6797.2 |
| B | 0 | 182 | 445798 | 61.31 | 28961 | 29052 | 6797.2 |
| B | 10 | 224 | 193405 | 24.18 | 28961 | 29052 | 6797.2 |
| C | 14 | 223 | 1251034 | 166.43 | 26396 | 27342 | 7352.5 |
| C | 8 | 208 | 164676 | 18.68 | 26396 | 27342 | 7352.5 |
| C | 9 | 54 | 152167 | 16.98 | 26396 | 27342 | 7352.5 |
| D | 10 | 84 | 13821065 | 1888.48 | 25348 | 25956 | 7304.9 |
| D | 13 | 53 | 2784562 | 377.64 | 25348 | 25956 | 7304.9 |
| D | 7 | 207 | 1188992 | 159.21 | 25348 | 25956 | 7304.9 |
Histogram calculated using DETX and DETY for each event in the final _common_clean file
| Quadrant A |  |
 |
Quadrant B |
|---|---|---|---|
| Quadrant D |  |
 |
Quadrant C |
| Plot type | Count rate plots | Images |
|---|---|---|
| Comparison with Poisson distribution Blue bars denote a histogram of data divided into 1 sec bins. Red curve is a Poisson curve with rate = median count rate of data. |
 |
 |
| Quadrant-wise count rates Data is divided into 100 sec bins |
 |
|
| Module-wise count rates for Quadrant A Data is divided into 100 sec bins |
 |
 |
| Module-wise count rates for Quadrant B Data is divided into 100 sec bins |
 |
 |
| Module-wise count rates for Quadrant C Data is divided into 100 sec bins |
 |
 |
| Module-wise count rates for Quadrant D Data is divided into 100 sec bins |
 |
 |
| Parameter | Plot |
|---|---|
| CZT HV Monitor |  |
| D_VDD |  |
| Temperature 1 |  |
| Veto HV Monitor |  |
| Veto LLD |  |
| Alpha Counter |  |
| _CPM_Rate |  |
| CZT Counter |  |
| +2.5 Volts monitor |  |
| +5 Volts monitor |  |
| _ROLL_ROT |  |
| _Roll_DEC |  |
| _Roll_RA |  |
| Veto Counter |  |