| Param | Original file | Final file |
|---|---|---|
| Filename | modeM0/AS1G02_016T01_9000000258cztM0_level2.evt | modeM0/AS1G02_016T01_9000000258cztM0_level2_quad_clean.evt |
| Size (bytes) | 10,619,196,480 | 807,710,400 |
| Size | 9.9 GB | 770.3 MB |
| Events in quadrant A | 81,381,769 | 5,051,489 |
| Events in quadrant B | 79,110,729 | 5,147,944 |
| Events in quadrant C | 74,243,195 | 5,052,702 |
| Events in quadrant D | 82,664,445 | 4,827,963 |
| Mode M0 | |||
|---|---|---|---|
| Quadrant | BADHDUFLAG | Total packets | Discarded packets |
| A | 0 | 287158 | 0 |
| B | 0 | 280447 | 0 |
| C | 0 | 266070 | 0 |
| D | 0 | 291269 | 0 |
| Mode M9 | |||
|---|---|---|---|
| Quadrant | BADHDUFLAG | Total packets | Discarded packets |
| A | 0 | 86 | 0 |
| B | 0 | 86 | 0 |
| C | 0 | 86 | 0 |
| D | 0 | 86 | 0 |
| Mode SS | |||
|---|---|---|---|
| Quadrant | BADHDUFLAG | Total packets | Discarded packets |
| A | 0 | 1302 | 0 |
| B | 0 | 1302 | 0 |
| C | 0 | 1302 | 0 |
| D | 0 | 1302 | 0 |
| Quadrant | Total seconds | Saturated seconds | Saturation percentage |
|---|---|---|---|
| A | 63934 | 847 | 1.324804% |
| B | 63934 | 300 | 0.469234% |
| C | 63934 | 233 | 0.364438% |
| D | 63934 | 2417 | 3.780461% |
Noise dominated data is calculated using 1-second bins in cleaned event files. If a bin has >2000 counts, and if more than 50% of those come from <1% of pixels, then it is considered to be noise-dominated and hence unusable.
| Quadrant | # 1 sec bins | Bins with >0 counts | Bins with >2000 counts | High rate bins dominated by noise | Noise dominated (total time) | Noise dominated (detector-on time) | Marked lightcurve |
|---|---|---|---|---|---|---|---|
| A | 72581 | 63945 | 4488 | 4488 | 6.18% | 7.02% |  |
| B | 72581 | 63946 | 2725 | 2725 | 3.75% | 4.26% |  |
| C | 72581 | 63944 | 2120 | 2120 | 2.92% | 3.32% |  |
| D | 72581 | 63945 | 6466 | 6466 | 8.91% | 10.11% |  |
Top three noisy pixels from each quadrant. If the there are fewer than three noisy pixels in the level2.evt file, extra rows are filled as -1
| Pixel properties | Quadrant properties | ||||||
|---|---|---|---|---|---|---|---|
| Quadrant | DetID | PixID | Counts | Sigma | Mean | Median | Sigma |
| A | 14 | 5 | 5043535 | 1052.95 | 19951 | 20111 | 4770.8 |
| A | 13 | 9 | 52092 | 6.7 | 19951 | 20111 | 4770.8 |
| A | 8 | 14 | 47610 | 5.76 | 19951 | 20111 | 4770.8 |
| B | 0 | 234 | 178006 | 32.27 | 20792 | 20947 | 4866.5 |
| B | 4 | 200 | 113667 | 19.05 | 20792 | 20947 | 4866.5 |
| B | 15 | 85 | 70633 | 10.21 | 20792 | 20947 | 4866.5 |
| C | 8 | 208 | 204247 | 35.09 | 18927 | 19623 | 5261.0 |
| C | 9 | 54 | 143704 | 23.59 | 18927 | 19623 | 5261.0 |
| C | 12 | 4 | 94837 | 14.3 | 18927 | 19623 | 5261.0 |
| D | 10 | 84 | 7906817 | 1413.76 | 18251 | 18981 | 5579.3 |
| D | 7 | 207 | 4846905 | 865.32 | 18251 | 18981 | 5579.3 |
| D | 13 | 169 | 541257 | 93.61 | 18251 | 18981 | 5579.3 |
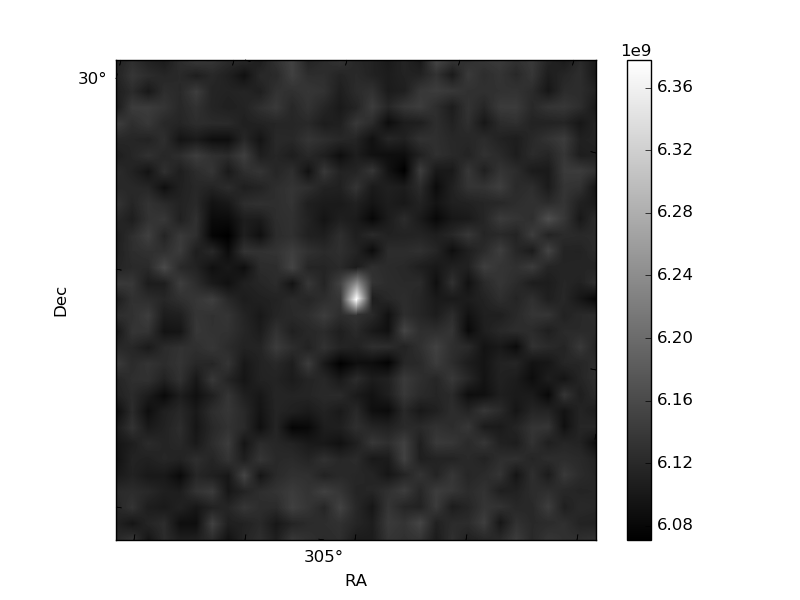
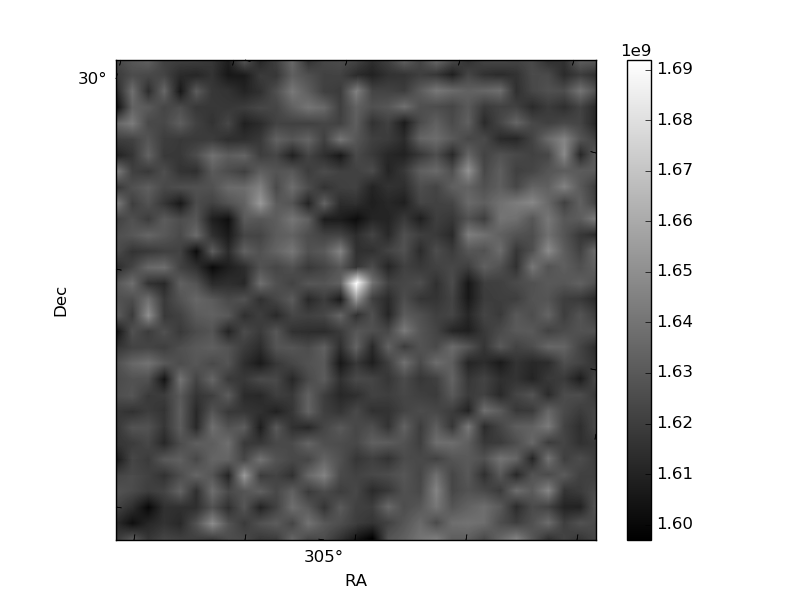
Histogram calculated using DETX and DETY for each event in the final _common_clean file
| Quadrant A |  |
 |
Quadrant B |
|---|---|---|---|
| Quadrant D |  |
 |
Quadrant C |
| Plot type | Count rate plots | Images |
|---|---|---|
| Comparison with Poisson distribution Blue bars denote a histogram of data divided into 1 sec bins. Red curve is a Poisson curve with rate = median count rate of data. |
 |
 |
| Quadrant-wise count rates Data is divided into 100 sec bins |
 |
|
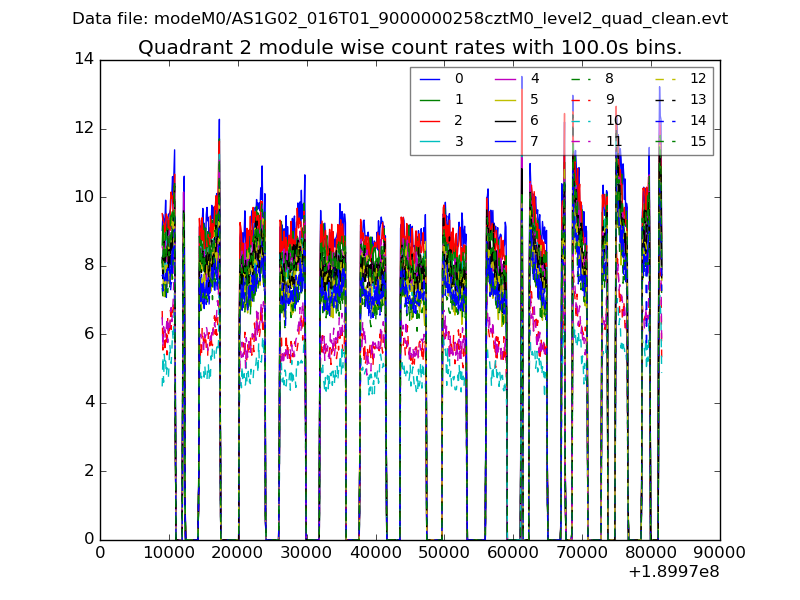
| Module-wise count rates for Quadrant A Data is divided into 100 sec bins |
 |
 |
| Module-wise count rates for Quadrant B Data is divided into 100 sec bins |
 |
 |
| Module-wise count rates for Quadrant C Data is divided into 100 sec bins |
 |
 |
| Module-wise count rates for Quadrant D Data is divided into 100 sec bins |
 |
 |
| Parameter | Plot |
|---|---|
| CZT HV Monitor |  |
| D_VDD | 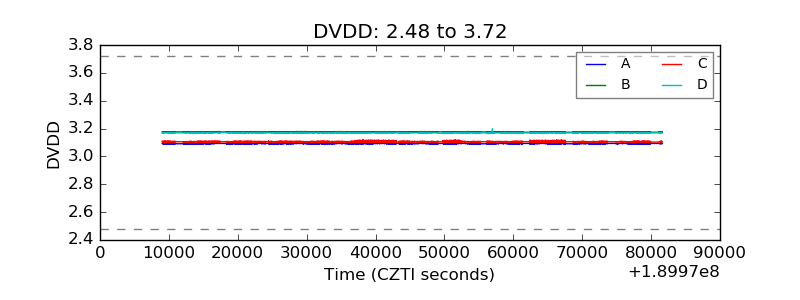 |
| Temperature 1 | 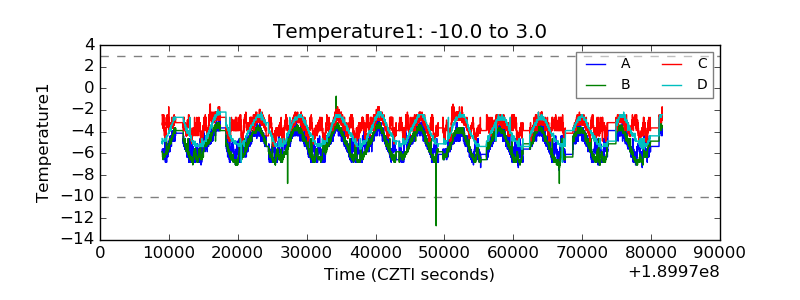 |
| Veto HV Monitor |  |
| Veto LLD |  |
| Alpha Counter |  |
| _CPM_Rate | 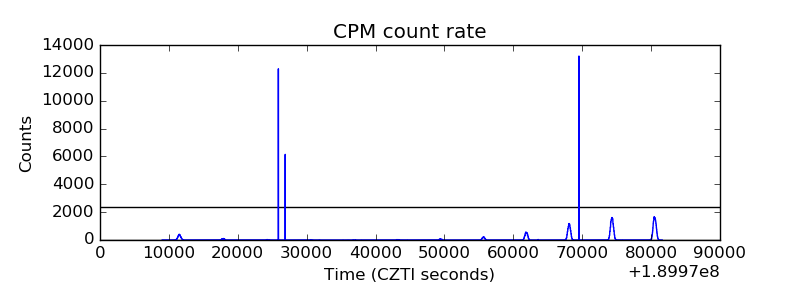 |
| CZT Counter |  |
| +2.5 Volts monitor |  |
| +5 Volts monitor |  |
| _ROLL_ROT | 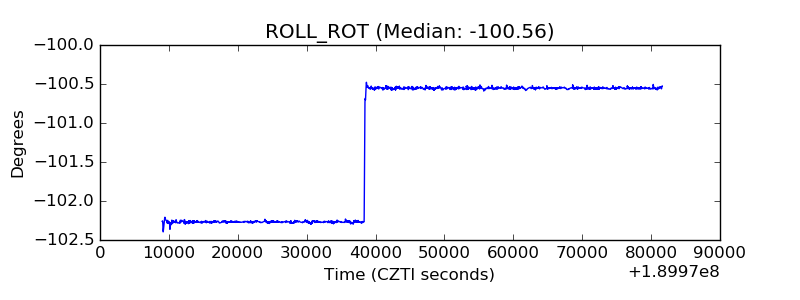 |
| _Roll_DEC |  |
| _Roll_RA |  |
| Veto Counter | 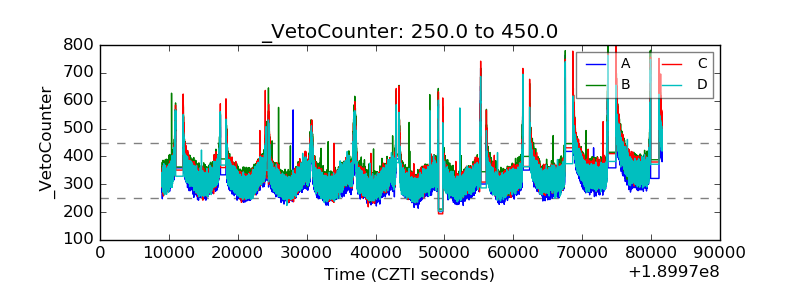 |