| Param | Original file | Final file |
|---|---|---|
| Filename | modeM0/AS1G02_012T01_9000000256cztM0_level2_bc.evt | modeM0/AS1G02_012T01_9000000256cztM0_level2_quad_clean.evt |
| Size (bytes) | 317,592,000 | 124,850,880 |
| Size | 302.9 MB | 119.1 MB |
| Events in quadrant A | 1,909,297 | 789,095 |
| Events in quadrant B | 1,974,908 | 789,570 |
| Events in quadrant C | 1,923,716 | 765,909 |
| Events in quadrant D | 3,121,485 | 744,236 |
| Mode SS | |||
|---|---|---|---|
| Quadrant | BADHDUFLAG | Total packets | Discarded packets |
| A | 0 | 204 | 0 |
| B | 0 | 204 | 0 |
| C | 0 | 204 | 0 |
| D | 0 | 204 | 0 |
| Mode M9 | |||
|---|---|---|---|
| Quadrant | BADHDUFLAG | Total packets | Discarded packets |
| A | 0 | 24 | 0 |
| B | 0 | 24 | 0 |
| C | 0 | 24 | 0 |
| D | 0 | 24 | 0 |
| Mode M0 | |||
|---|---|---|---|
| Quadrant | BADHDUFLAG | Total packets | Discarded packets |
| A | 0 | 42610 | 0 |
| B | 0 | 43681 | 0 |
| C | 0 | 41746 | 0 |
| D | 0 | 43883 | 0 |
| Quadrant | Total seconds | Saturated seconds | Saturation percentage |
|---|---|---|---|
| A | 9991 | 163 | 1.631468% |
| B | 9991 | 144 | 1.441297% |
| C | 9991 | 124 | 1.241117% |
| D | 9991 | 268 | 2.682414% |
Noise dominated data is calculated using 1-second bins in cleaned event files. If a bin has >2000 counts, and if more than 50% of those come from <1% of pixels, then it is considered to be noise-dominated and hence unusable.
| Quadrant | # 1 sec bins | Bins with >0 counts | Bins with >2000 counts | High rate bins dominated by noise | Noise dominated (total time) | Noise dominated (detector-on time) | Marked lightcurve |
|---|---|---|---|---|---|---|---|
| A | 12361 | 9990 | 0 | 0 | 0.00% | 0.00% |  |
| B | 12361 | 9990 | 0 | 0 | 0.00% | 0.00% |  |
| C | 12361 | 9991 | 0 | 0 | 0.00% | 0.00% |  |
| D | 12361 | 9989 | 19 | 19 | 0.15% | 0.19% |  |
Top three noisy pixels from each quadrant. If the there are fewer than three noisy pixels in the level2.evt file, extra rows are filled as -1
| Pixel properties | Quadrant properties | ||||||
|---|---|---|---|---|---|---|---|
| Quadrant | DetID | PixID | Counts | Sigma | Mean | Median | Sigma |
| A | 13 | 9 | 9165 | 81.57 | 489 | 475 | 106.5 |
| A | 10 | 2 | 7635 | 67.21 | 489 | 475 | 106.5 |
| A | 8 | 14 | 6283 | 54.52 | 489 | 475 | 106.5 |
| B | 0 | 234 | 17347 | 185.76 | 498 | 484 | 90.8 |
| B | 0 | 220 | 15475 | 165.14 | 498 | 484 | 90.8 |
| B | 0 | 190 | 10174 | 106.74 | 498 | 484 | 90.8 |
| C | 9 | 54 | 19601 | 188.59 | 478 | 467 | 101.5 |
| C | 10 | 19 | 16148 | 154.55 | 478 | 467 | 101.5 |
| C | 10 | 34 | 3054 | 25.5 | 478 | 467 | 101.5 |
| D | 10 | 84 | 1045188 | 10185.36 | 475 | 458 | 102.6 |
| D | 7 | 85 | 97442 | 945.52 | 475 | 458 | 102.6 |
| D | 13 | 169 | 55192 | 533.62 | 475 | 458 | 102.6 |
Histogram calculated using DETX and DETY for each event in the final _common_clean file
| Quadrant A |  |
 |
Quadrant B |
|---|---|---|---|
| Quadrant D |  |
 |
Quadrant C |
| Plot type | Count rate plots | Images |
|---|---|---|
| Comparison with Poisson distribution Blue bars denote a histogram of data divided into 1 sec bins. Red curve is a Poisson curve with rate = median count rate of data. |
 |
 |
| Quadrant-wise count rates Data is divided into 100 sec bins |
 |
|
| Module-wise count rates for Quadrant A Data is divided into 100 sec bins |
 |
 |
| Module-wise count rates for Quadrant B Data is divided into 100 sec bins |
 |
 |
| Module-wise count rates for Quadrant C Data is divided into 100 sec bins |
 |
 |
| Module-wise count rates for Quadrant D Data is divided into 100 sec bins |
 |
 |
| Parameter | Plot |
|---|---|
| CZT HV Monitor |  |
| D_VDD | 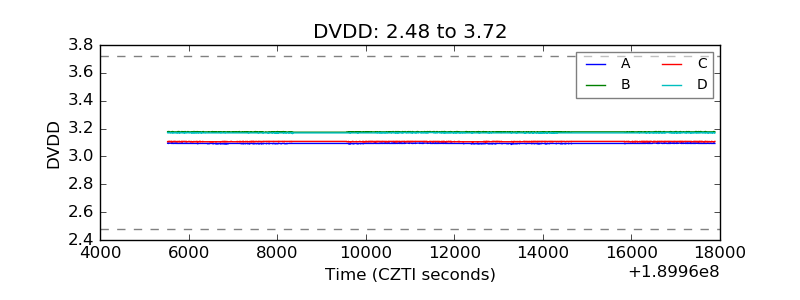 |
| Temperature 1 |  |
| Veto HV Monitor |  |
| Veto LLD |  |
| Alpha Counter |  |
| _CPM_Rate |  |
| CZT Counter |  |
| +2.5 Volts monitor |  |
| +5 Volts monitor |  |
| _ROLL_ROT |  |
| _Roll_DEC | 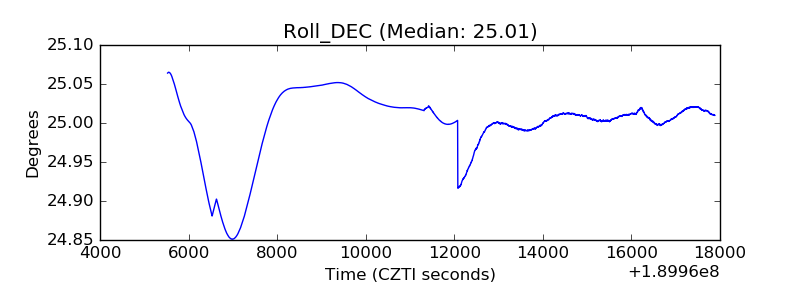 |
| _Roll_RA |  |
| Veto Counter |  |