| Param | Original file | Final file |
|---|---|---|
| Filename | modeM0/AS1G02_011T01_9000000254cztM0_level2_bc.evt | modeM0/AS1G02_011T01_9000000254cztM0_level2_quad_clean.evt |
| Size (bytes) | 524,666,880 | 165,945,600 |
| Size | 500.4 MB | 158.3 MB |
| Events in quadrant A | 2,567,059 | 1,087,519 |
| Events in quadrant B | 2,806,650 | 1,088,542 |
| Events in quadrant C | 2,648,566 | 1,063,984 |
| Events in quadrant D | 6,973,084 | 886,356 |
| Mode M0 | |||
|---|---|---|---|
| Quadrant | BADHDUFLAG | Total packets | Discarded packets |
| A | 0 | 56747 | 0 |
| B | 0 | 58321 | 0 |
| C | 0 | 54955 | 0 |
| D | 0 | 76207 | 0 |
| Mode M9 | |||
|---|---|---|---|
| Quadrant | BADHDUFLAG | Total packets | Discarded packets |
| A | 0 | 33 | 0 |
| B | 0 | 33 | 0 |
| C | 0 | 33 | 0 |
| D | 0 | 33 | 0 |
| Mode SS | |||
|---|---|---|---|
| Quadrant | BADHDUFLAG | Total packets | Discarded packets |
| A | 0 | 266 | 0 |
| B | 0 | 266 | 0 |
| C | 0 | 266 | 0 |
| D | 0 | 266 | 0 |
| Quadrant | Total seconds | Saturated seconds | Saturation percentage |
|---|---|---|---|
| A | 13006 | 143 | 1.099493% |
| B | 13006 | 142 | 1.091804% |
| C | 13006 | 104 | 0.799631% |
| D | 13006 | 2790 | 21.451638% |
Noise dominated data is calculated using 1-second bins in cleaned event files. If a bin has >2000 counts, and if more than 50% of those come from <1% of pixels, then it is considered to be noise-dominated and hence unusable.
| Quadrant | # 1 sec bins | Bins with >0 counts | Bins with >2000 counts | High rate bins dominated by noise | Noise dominated (total time) | Noise dominated (detector-on time) | Marked lightcurve |
|---|---|---|---|---|---|---|---|
| A | 16366 | 13004 | 0 | 0 | 0.00% | 0.00% | 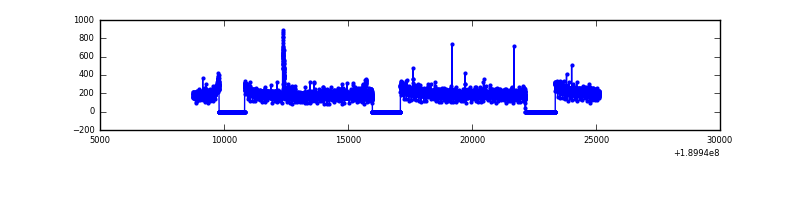 |
| B | 16366 | 13003 | 0 | 0 | 0.00% | 0.00% | 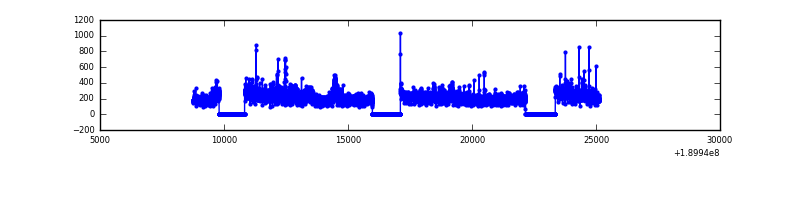 |
| C | 16366 | 13003 | 1 | 1 | 0.01% | 0.01% |  |
| D | 16366 | 13003 | 79 | 79 | 0.48% | 0.61% |  |
Top three noisy pixels from each quadrant. If the there are fewer than three noisy pixels in the level2.evt file, extra rows are filled as -1
| Pixel properties | Quadrant properties | ||||||
|---|---|---|---|---|---|---|---|
| Quadrant | DetID | PixID | Counts | Sigma | Mean | Median | Sigma |
| A | 15 | 233 | 33618 | 240.92 | 652 | 637 | 136.9 |
| A | 13 | 9 | 13216 | 91.89 | 652 | 637 | 136.9 |
| A | 10 | 2 | 6565 | 43.3 | 652 | 637 | 136.9 |
| B | 0 | 234 | 197564 | 1669.66 | 661 | 642 | 117.9 |
| B | 15 | 85 | 20577 | 169.02 | 661 | 642 | 117.9 |
| B | 3 | 204 | 14459 | 117.15 | 661 | 642 | 117.9 |
| C | 7 | 221 | 95421 | 710.29 | 631 | 620 | 133.5 |
| C | 9 | 54 | 36706 | 270.37 | 631 | 620 | 133.5 |
| C | 9 | 144 | 13210 | 94.33 | 631 | 620 | 133.5 |
| D | 10 | 84 | 4642463 | 37954.25 | 563 | 547 | 122.3 |
| D | 13 | 53 | 106030 | 862.47 | 563 | 547 | 122.3 |
| D | 7 | 85 | 45255 | 365.55 | 563 | 547 | 122.3 |
Histogram calculated using DETX and DETY for each event in the final _common_clean file
| Quadrant A |  |
 |
Quadrant B |
|---|---|---|---|
| Quadrant D |  |
 |
Quadrant C |
| Plot type | Count rate plots | Images |
|---|---|---|
| Comparison with Poisson distribution Blue bars denote a histogram of data divided into 1 sec bins. Red curve is a Poisson curve with rate = median count rate of data. |
 |
 |
| Quadrant-wise count rates Data is divided into 100 sec bins |
 |
|
| Module-wise count rates for Quadrant A Data is divided into 100 sec bins |
 |
 |
| Module-wise count rates for Quadrant B Data is divided into 100 sec bins |
 |
 |
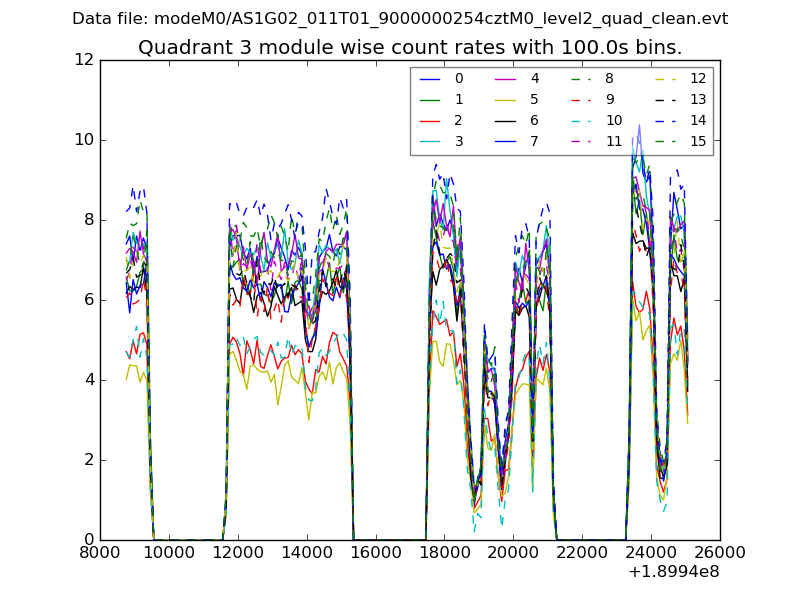
| Module-wise count rates for Quadrant C Data is divided into 100 sec bins |
 |
 |
| Module-wise count rates for Quadrant D Data is divided into 100 sec bins |
 |
 |
| Parameter | Plot |
|---|---|
| CZT HV Monitor |  |
| D_VDD | 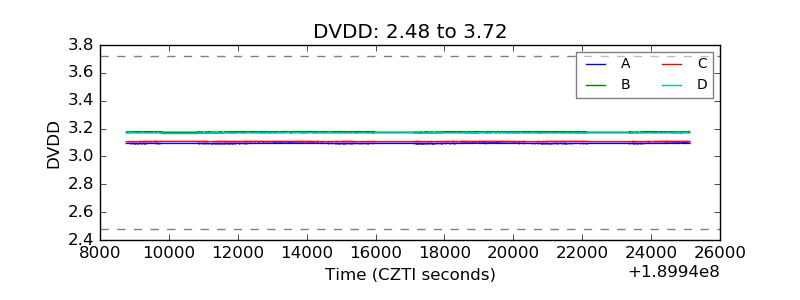 |
| Temperature 1 |  |
| Veto HV Monitor |  |
| Veto LLD |  |
| Alpha Counter | 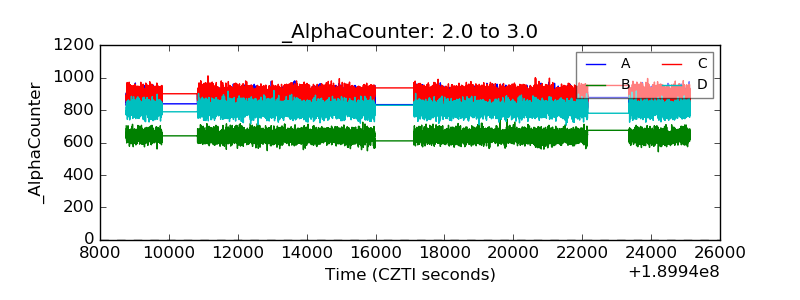 |
| _CPM_Rate |  |
| CZT Counter |  |
| +2.5 Volts monitor |  |
| +5 Volts monitor |  |
| _ROLL_ROT |  |
| _Roll_DEC |  |
| _Roll_RA |  |
| Veto Counter |  |