| Param | Original file | Final file |
|---|---|---|
| Filename | modeM0/AS1G02_010T01_9000000252cztM0_level2_bc.evt | modeM0/AS1G02_010T01_9000000252cztM0_level2_quad_clean.evt |
| Size (bytes) | 2,922,174,720 | 1,220,892,480 |
| Size | 2.7 GB | 1.1 GB |
| Events in quadrant A | 17,448,371 | 7,892,765 |
| Events in quadrant B | 18,585,832 | 7,985,196 |
| Events in quadrant C | 18,515,400 | 7,835,689 |
| Events in quadrant D | 27,972,115 | 7,257,251 |
| Mode SS | |||
|---|---|---|---|
| Quadrant | BADHDUFLAG | Total packets | Discarded packets |
| A | 0 | 955 | 0 |
| B | 0 | 955 | 0 |
| C | 0 | 955 | 0 |
| D | 0 | 955 | 0 |
| Mode M9 | |||
|---|---|---|---|
| Quadrant | BADHDUFLAG | Total packets | Discarded packets |
| A | 0 | 126 | 0 |
| B | 0 | 126 | 0 |
| C | 0 | 126 | 0 |
| D | 0 | 126 | 0 |
| Mode M0 | |||
|---|---|---|---|
| Quadrant | BADHDUFLAG | Total packets | Discarded packets |
| A | 0 | 402583 | 0 |
| B | 0 | 415315 | 0 |
| C | 0 | 393502 | 0 |
| D | 0 | 421521 | 0 |
| Quadrant | Total seconds | Saturated seconds | Saturation percentage |
|---|---|---|---|
| A | 93611 | 564 | 0.602493% |
| B | 93805 | 618 | 0.658813% |
| C | 93890 | 399 | 0.424965% |
| D | 93813 | 4279 | 4.561202% |
Noise dominated data is calculated using 1-second bins in cleaned event files. If a bin has >2000 counts, and if more than 50% of those come from <1% of pixels, then it is considered to be noise-dominated and hence unusable.
| Quadrant | # 1 sec bins | Bins with >0 counts | Bins with >2000 counts | High rate bins dominated by noise | Noise dominated (total time) | Noise dominated (detector-on time) | Marked lightcurve |
|---|---|---|---|---|---|---|---|
| A | 113124 | 93610 | 0 | 0 | 0.00% | 0.00% |  |
| B | 113124 | 93800 | 8 | 8 | 0.01% | 0.01% |  |
| C | 113124 | 93888 | 29 | 29 | 0.03% | 0.03% | 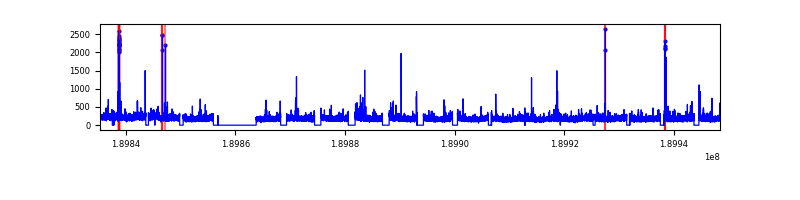 |
| D | 113124 | 93805 | 287 | 287 | 0.25% | 0.31% |  |
Top three noisy pixels from each quadrant. If the there are fewer than three noisy pixels in the level2.evt file, extra rows are filled as -1
| Pixel properties | Quadrant properties | ||||||
|---|---|---|---|---|---|---|---|
| Quadrant | DetID | PixID | Counts | Sigma | Mean | Median | Sigma |
| A | 8 | 14 | 90347 | 91.28 | 4419 | 4330 | 942.3 |
| A | 8 | 15 | 81552 | 81.95 | 4419 | 4330 | 942.3 |
| A | 13 | 9 | 74145 | 74.09 | 4419 | 4330 | 942.3 |
| B | 6 | 53 | 185821 | 224.37 | 4521 | 4403 | 808.6 |
| B | 0 | 234 | 167839 | 202.13 | 4521 | 4403 | 808.6 |
| B | 12 | 52 | 147265 | 176.68 | 4521 | 4403 | 808.6 |
| C | 15 | 241 | 392879 | 424.45 | 4370 | 4328 | 915.4 |
| C | 9 | 52 | 387376 | 418.44 | 4370 | 4328 | 915.4 |
| C | 9 | 54 | 116222 | 122.23 | 4370 | 4328 | 915.4 |
| D | 10 | 84 | 7541633 | 8089.07 | 4238 | 4122 | 931.8 |
| D | 7 | 85 | 1263988 | 1352.06 | 4238 | 4122 | 931.8 |
| D | 13 | 53 | 746166 | 796.34 | 4238 | 4122 | 931.8 |
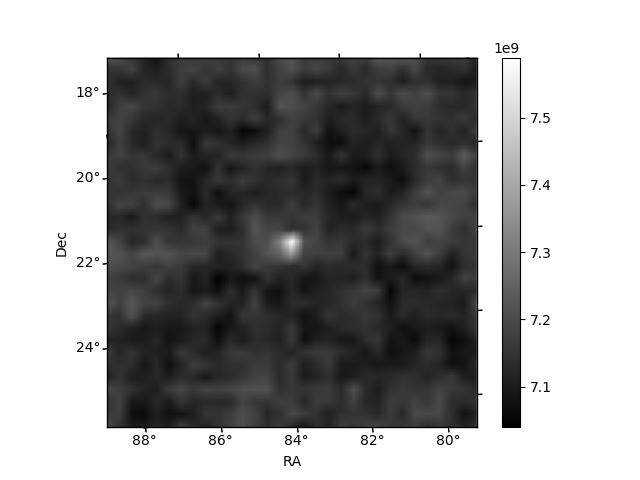
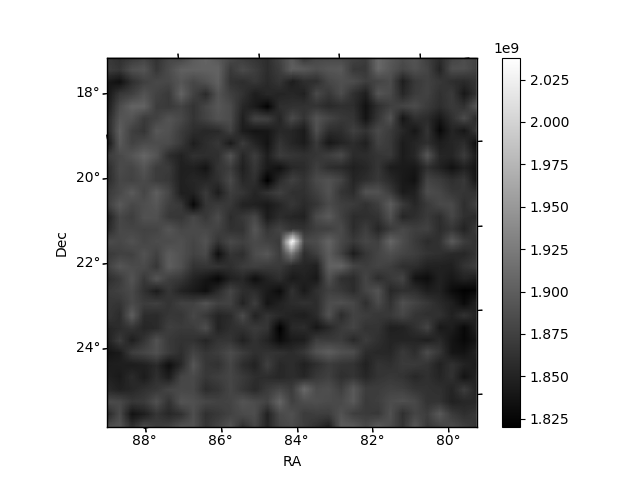
Histogram calculated using DETX and DETY for each event in the final _common_clean file
| Quadrant A |  |
 |
Quadrant B |
|---|---|---|---|
| Quadrant D |  |
 |
Quadrant C |
| Plot type | Count rate plots | Images |
|---|---|---|
| Comparison with Poisson distribution Blue bars denote a histogram of data divided into 1 sec bins. Red curve is a Poisson curve with rate = median count rate of data. |
 |
 |
| Quadrant-wise count rates Data is divided into 100 sec bins |
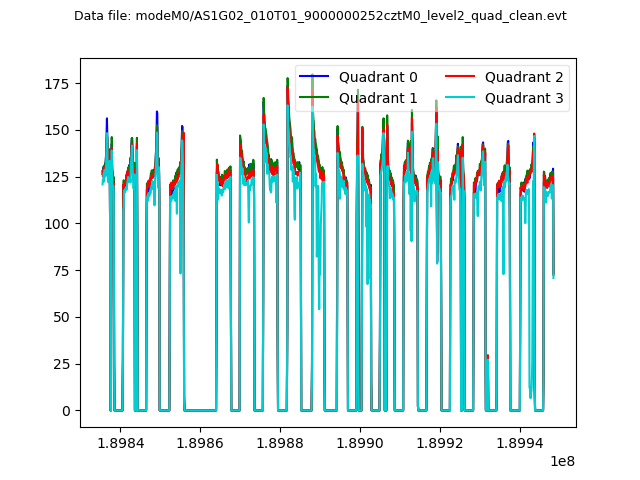 |
|
| Module-wise count rates for Quadrant A Data is divided into 100 sec bins |
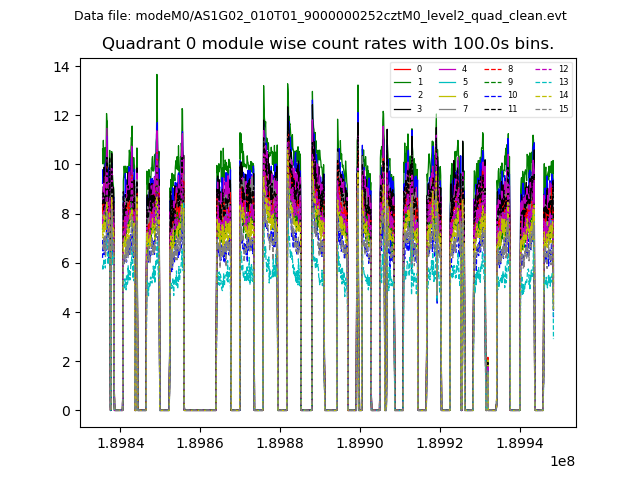 |
 |
| Module-wise count rates for Quadrant B Data is divided into 100 sec bins |
 |
 |
| Module-wise count rates for Quadrant C Data is divided into 100 sec bins |
 |
 |
| Module-wise count rates for Quadrant D Data is divided into 100 sec bins |
 |
 |
| Parameter | Plot |
|---|---|
| CZT HV Monitor |  |
| D_VDD | 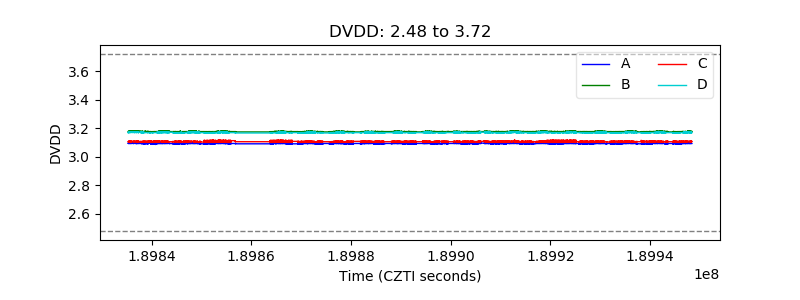 |
| Temperature 1 |  |
| Veto HV Monitor |  |
| Veto LLD |  |
| Alpha Counter |  |
| _CPM_Rate | 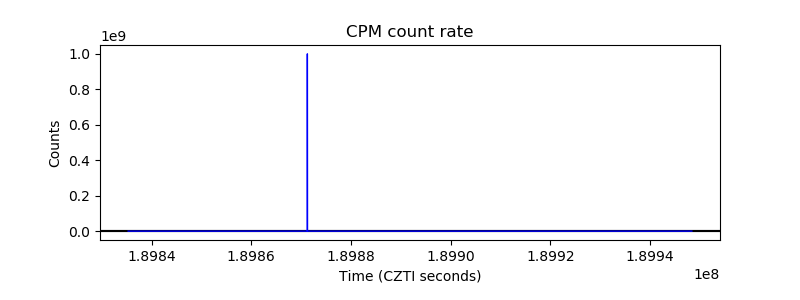 |
| CZT Counter | 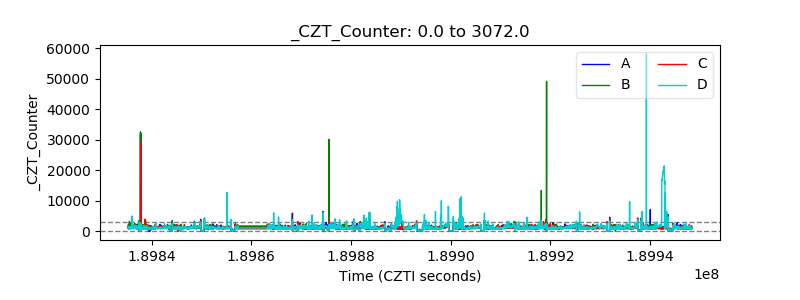 |
| +2.5 Volts monitor | 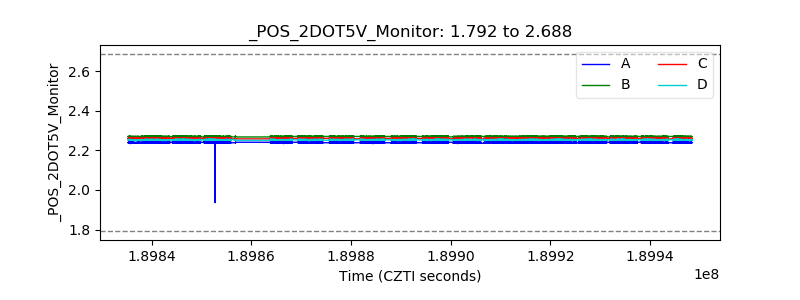 |
| +5 Volts monitor |  |
| _ROLL_ROT |  |
| _Roll_DEC |  |
| _Roll_RA |  |
| Veto Counter |  |