| Param | Original file | Final file |
|---|---|---|
| Filename | modeM0/AS1T01_023T01_9000000250cztM0_level2.evt | modeM0/AS1T01_023T01_9000000250cztM0_level2_quad_clean.evt |
| Size (bytes) | 11,797,971,840 | 805,170,240 |
| Size | 11.0 GB | 767.9 MB |
| Events in quadrant A | 89,533,311 | 4,896,790 |
| Events in quadrant B | 92,111,032 | 4,989,799 |
| Events in quadrant C | 84,512,495 | 4,917,257 |
| Events in quadrant D | 86,479,954 | 4,714,983 |
| Mode SS | |||
|---|---|---|---|
| Quadrant | BADHDUFLAG | Total packets | Discarded packets |
| A | 0 | 1448 | 0 |
| B | 0 | 1448 | 0 |
| C | 0 | 1448 | 0 |
| D | 0 | 1448 | 0 |
| Mode M9 | |||
|---|---|---|---|
| Quadrant | BADHDUFLAG | Total packets | Discarded packets |
| A | 0 | 103 | 0 |
| B | 0 | 103 | 0 |
| C | 0 | 103 | 0 |
| D | 0 | 103 | 0 |
| Mode M0 | |||
|---|---|---|---|
| Quadrant | BADHDUFLAG | Total packets | Discarded packets |
| A | 0 | 316171 | 0 |
| B | 0 | 323949 | 0 |
| C | 0 | 301504 | 0 |
| D | 0 | 307619 | 0 |
| Quadrant | Total seconds | Saturated seconds | Saturation percentage |
|---|---|---|---|
| A | 70984 | 416 | 0.586048% |
| B | 70984 | 530 | 0.746647% |
| C | 70984 | 288 | 0.405725% |
| D | 70984 | 1908 | 2.687930% |
Noise dominated data is calculated using 1-second bins in cleaned event files. If a bin has >2000 counts, and if more than 50% of those come from <1% of pixels, then it is considered to be noise-dominated and hence unusable.
| Quadrant | # 1 sec bins | Bins with >0 counts | Bins with >2000 counts | High rate bins dominated by noise | Noise dominated (total time) | Noise dominated (detector-on time) | Marked lightcurve |
|---|---|---|---|---|---|---|---|
| A | 81534 | 70992 | 3753 | 3753 | 4.60% | 5.29% |  |
| B | 81534 | 70991 | 4152 | 4152 | 5.09% | 5.85% |  |
| C | 81534 | 70991 | 2394 | 2394 | 2.94% | 3.37% |  |
| D | 81534 | 70991 | 4817 | 4817 | 5.91% | 6.79% |  |
Top three noisy pixels from each quadrant. If the there are fewer than three noisy pixels in the level2.evt file, extra rows are filled as -1
| Pixel properties | Quadrant properties | ||||||
|---|---|---|---|---|---|---|---|
| Quadrant | DetID | PixID | Counts | Sigma | Mean | Median | Sigma |
| A | 15 | 127 | 5395559 | 1029.17 | 21810 | 21987 | 5221.3 |
| A | 4 | 32 | 172092 | 28.75 | 21810 | 21987 | 5221.3 |
| A | 13 | 235 | 123605 | 19.46 | 21810 | 21987 | 5221.3 |
| B | 8 | 4 | 2912249 | 539.76 | 22754 | 22879 | 5353.1 |
| B | 6 | 53 | 808576 | 146.77 | 22754 | 22879 | 5353.1 |
| B | 12 | 52 | 695805 | 125.71 | 22754 | 22879 | 5353.1 |
| C | 15 | 241 | 2696506 | 463.73 | 20761 | 21510 | 5768.5 |
| C | 3 | 111 | 225160 | 35.3 | 20761 | 21510 | 5768.5 |
| C | 3 | 79 | 165866 | 25.02 | 20761 | 21510 | 5768.5 |
| D | 9 | 53 | 9354912 | 1505.39 | 19997 | 20799 | 6200.5 |
| D | 9 | 66 | 1277923 | 202.75 | 19997 | 20799 | 6200.5 |
| D | 2 | 88 | 350891 | 53.24 | 19997 | 20799 | 6200.5 |
Histogram calculated using DETX and DETY for each event in the final _common_clean file
| Quadrant A |  |
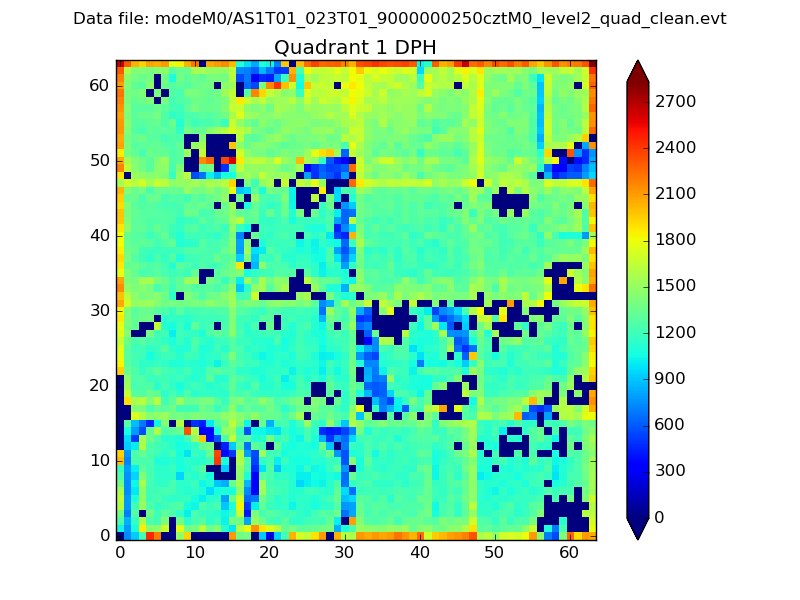 |
Quadrant B |
|---|---|---|---|
| Quadrant D |  |
 |
Quadrant C |
| Plot type | Count rate plots | Images |
|---|---|---|
| Comparison with Poisson distribution Blue bars denote a histogram of data divided into 1 sec bins. Red curve is a Poisson curve with rate = median count rate of data. |
 |
 |
| Quadrant-wise count rates Data is divided into 100 sec bins |
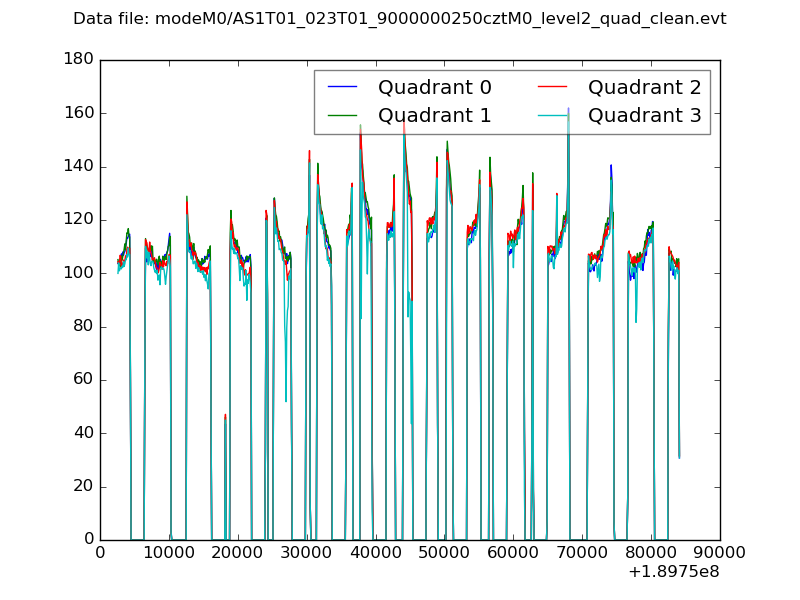 |
|
| Module-wise count rates for Quadrant A Data is divided into 100 sec bins |
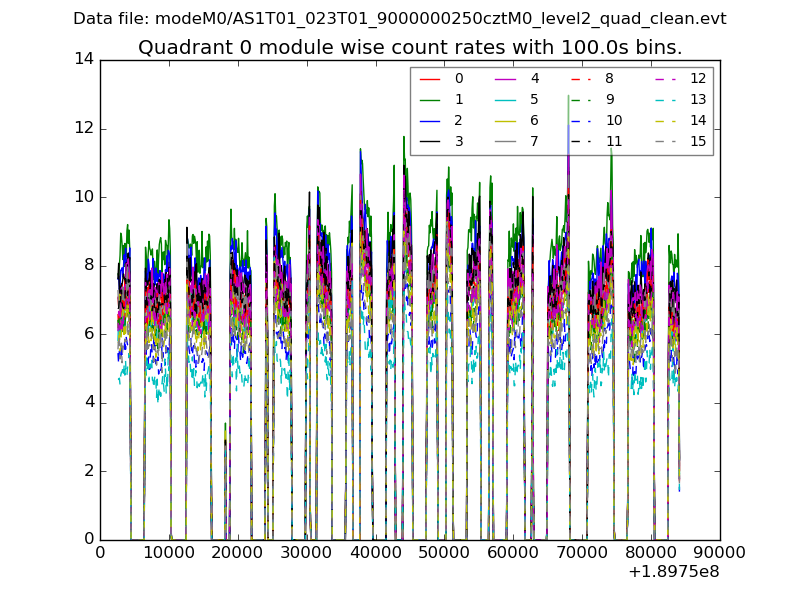 |
 |
| Module-wise count rates for Quadrant B Data is divided into 100 sec bins |
 |
 |
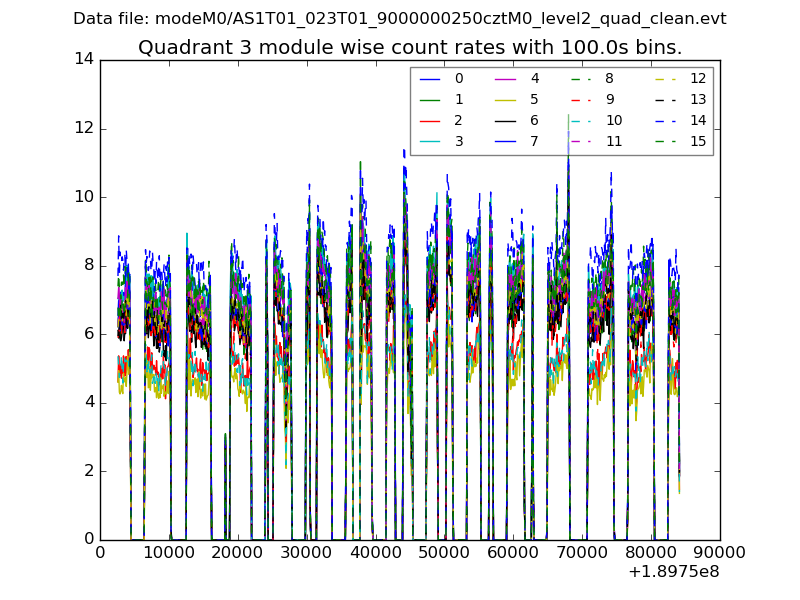
| Module-wise count rates for Quadrant C Data is divided into 100 sec bins |
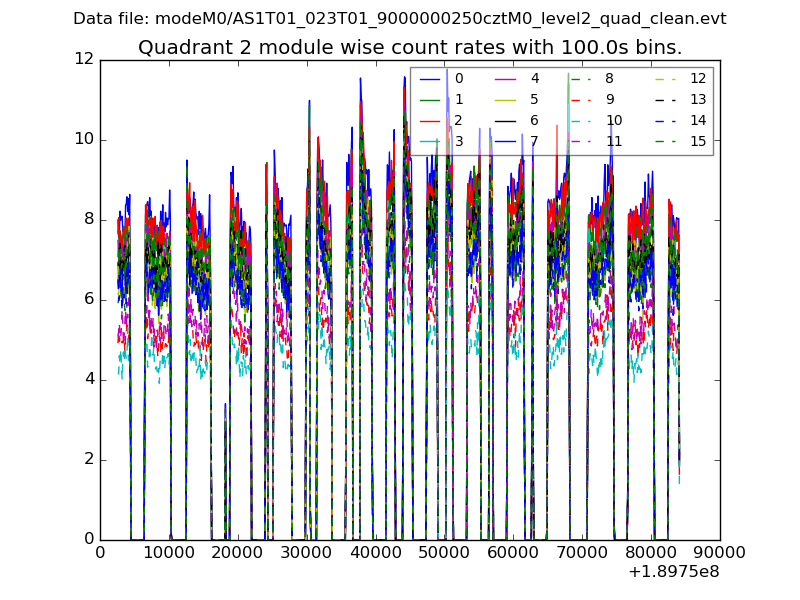 |
 |
| Module-wise count rates for Quadrant D Data is divided into 100 sec bins |
 |
 |
| Parameter | Plot |
|---|---|
| CZT HV Monitor | 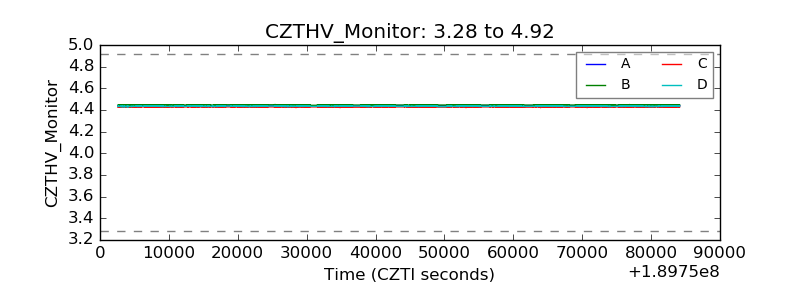 |
| D_VDD |  |
| Temperature 1 |  |
| Veto HV Monitor |  |
| Veto LLD |  |
| Alpha Counter | 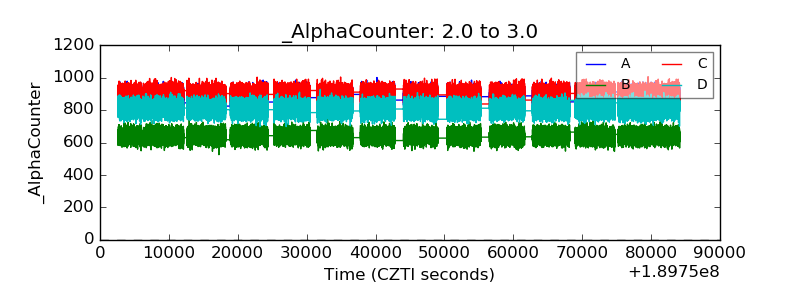 |
| _CPM_Rate |  |
| CZT Counter |  |
| +2.5 Volts monitor |  |
| +5 Volts monitor |  |
| _ROLL_ROT |  |
| _Roll_DEC |  |
| _Roll_RA | 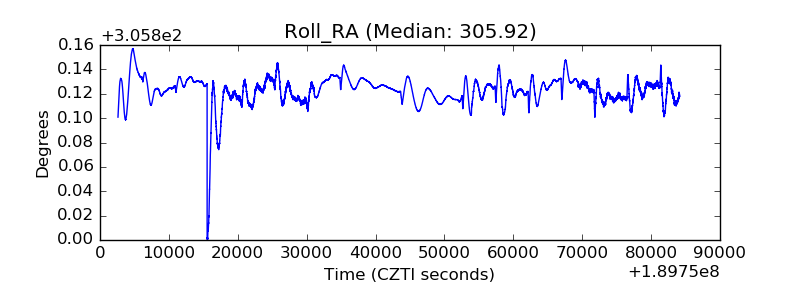 |
| Veto Counter |  |