| Param | Original file | Final file |
|---|---|---|
| Filename | modeM0/AS1T01_023T01_9000000246cztM0_level2.evt | modeM0/AS1T01_023T01_9000000246cztM0_level2_quad_clean.evt |
| Size (bytes) | 11,468,741,760 | 798,229,440 |
| Size | 10.7 GB | 761.3 MB |
| Events in quadrant A | 87,422,166 | 4,808,157 |
| Events in quadrant B | 93,041,669 | 4,923,600 |
| Events in quadrant C | 84,022,024 | 4,860,614 |
| Events in quadrant D | 78,188,741 | 4,729,848 |
| Mode SS | |||
|---|---|---|---|
| Quadrant | BADHDUFLAG | Total packets | Discarded packets |
| A | 0 | 1440 | 0 |
| B | 0 | 1440 | 0 |
| C | 0 | 1440 | 0 |
| D | 0 | 1440 | 0 |
| Mode M9 | |||
|---|---|---|---|
| Quadrant | BADHDUFLAG | Total packets | Discarded packets |
| A | 0 | 96 | 0 |
| B | 0 | 96 | 0 |
| C | 0 | 96 | 0 |
| D | 0 | 97 | 0 |
| Mode M0 | |||
|---|---|---|---|
| Quadrant | BADHDUFLAG | Total packets | Discarded packets |
| A | 0 | 309863 | 0 |
| B | 0 | 326406 | 0 |
| C | 0 | 299937 | 0 |
| D | 0 | 282855 | 0 |
| Quadrant | Total seconds | Saturated seconds | Saturation percentage |
|---|---|---|---|
| A | 70782 | 825 | 1.165551% |
| B | 70782 | 518 | 0.731824% |
| C | 70782 | 278 | 0.392755% |
| D | 70782 | 445 | 0.628691% |
Noise dominated data is calculated using 1-second bins in cleaned event files. If a bin has >2000 counts, and if more than 50% of those come from <1% of pixels, then it is considered to be noise-dominated and hence unusable.
| Quadrant | # 1 sec bins | Bins with >0 counts | Bins with >2000 counts | High rate bins dominated by noise | Noise dominated (total time) | Noise dominated (detector-on time) | Marked lightcurve |
|---|---|---|---|---|---|---|---|
| A | 79957 | 70788 | 3940 | 3940 | 4.93% | 5.57% | 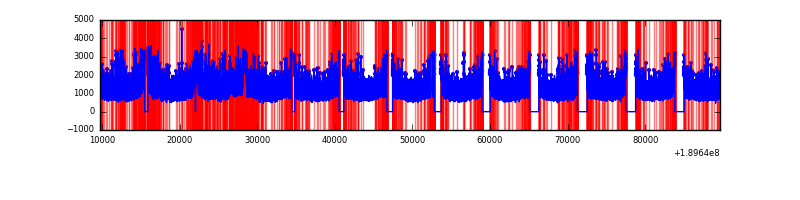 |
| B | 79957 | 70788 | 4820 | 4820 | 6.03% | 6.81% | 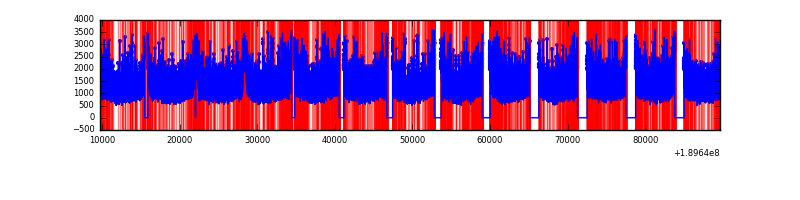 |
| C | 79957 | 70785 | 2519 | 2519 | 3.15% | 3.56% |  |
| D | 79957 | 70789 | 2398 | 2398 | 3.00% | 3.39% |  |
Top three noisy pixels from each quadrant. If the there are fewer than three noisy pixels in the level2.evt file, extra rows are filled as -1
| Pixel properties | Quadrant properties | ||||||
|---|---|---|---|---|---|---|---|
| Quadrant | DetID | PixID | Counts | Sigma | Mean | Median | Sigma |
| A | 15 | 127 | 2059459 | 388.17 | 21721 | 21892 | 5249.2 |
| A | 4 | 32 | 1004153 | 187.13 | 21721 | 21892 | 5249.2 |
| A | 0 | 36 | 777033 | 143.86 | 21721 | 21892 | 5249.2 |
| B | 8 | 4 | 4834747 | 897.45 | 22723 | 22828 | 5361.8 |
| B | 12 | 52 | 633626 | 113.92 | 22723 | 22828 | 5361.8 |
| B | 5 | 249 | 434134 | 76.71 | 22723 | 22828 | 5361.8 |
| C | 15 | 241 | 2321587 | 399.28 | 20680 | 21423 | 5760.7 |
| C | 8 | 208 | 235814 | 37.22 | 20680 | 21423 | 5760.7 |
| C | 3 | 111 | 226790 | 35.65 | 20680 | 21423 | 5760.7 |
| D | 9 | 53 | 1249237 | 197.65 | 20053 | 20859 | 6215.0 |
| D | 13 | 53 | 855616 | 134.31 | 20053 | 20859 | 6215.0 |
| D | 7 | 207 | 493380 | 76.03 | 20053 | 20859 | 6215.0 |
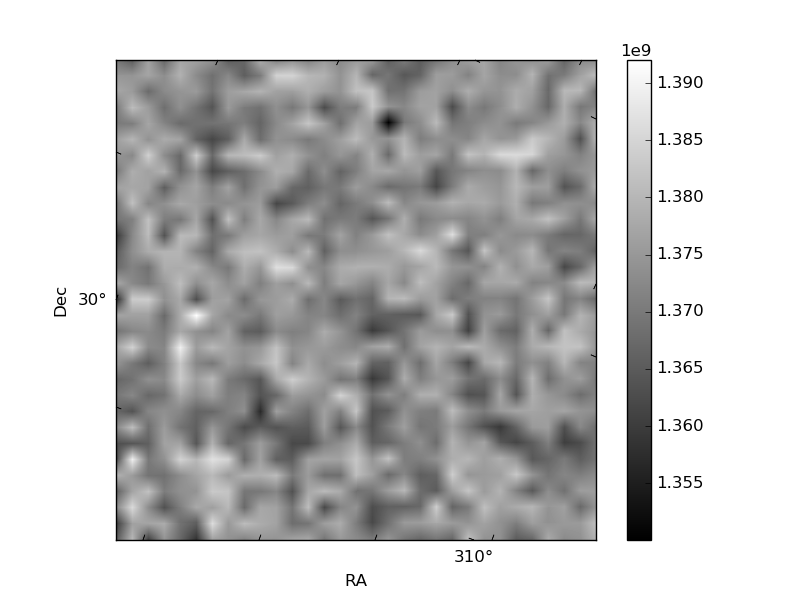
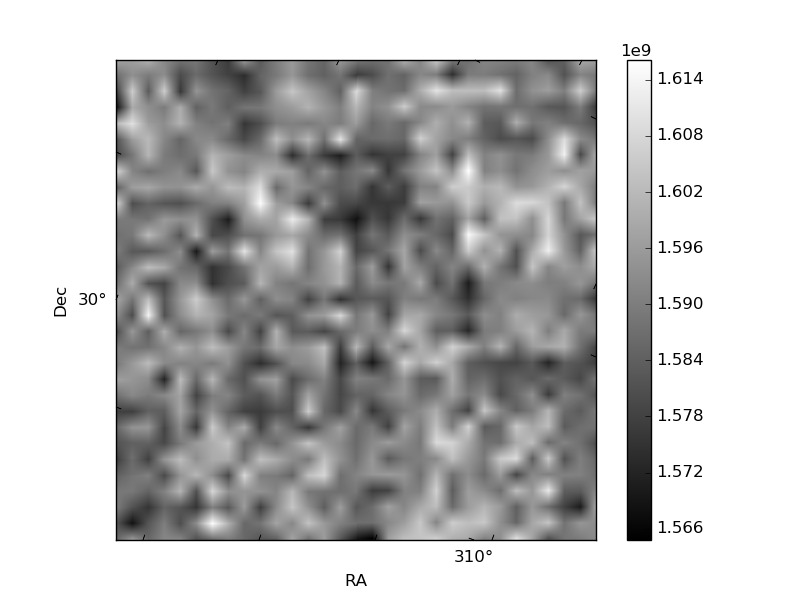
Histogram calculated using DETX and DETY for each event in the final _common_clean file
| Quadrant A | 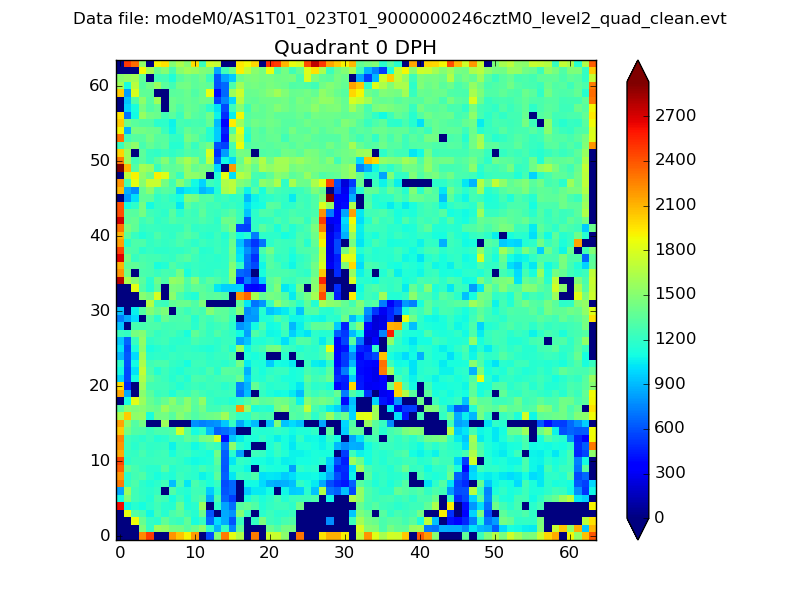 |
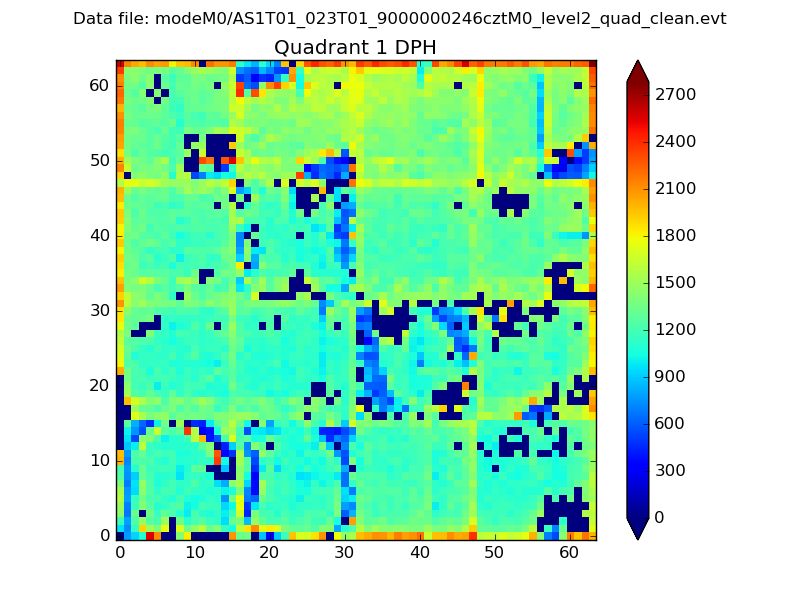 |
Quadrant B |
|---|---|---|---|
| Quadrant D |  |
 |
Quadrant C |
| Plot type | Count rate plots | Images |
|---|---|---|
| Comparison with Poisson distribution Blue bars denote a histogram of data divided into 1 sec bins. Red curve is a Poisson curve with rate = median count rate of data. |
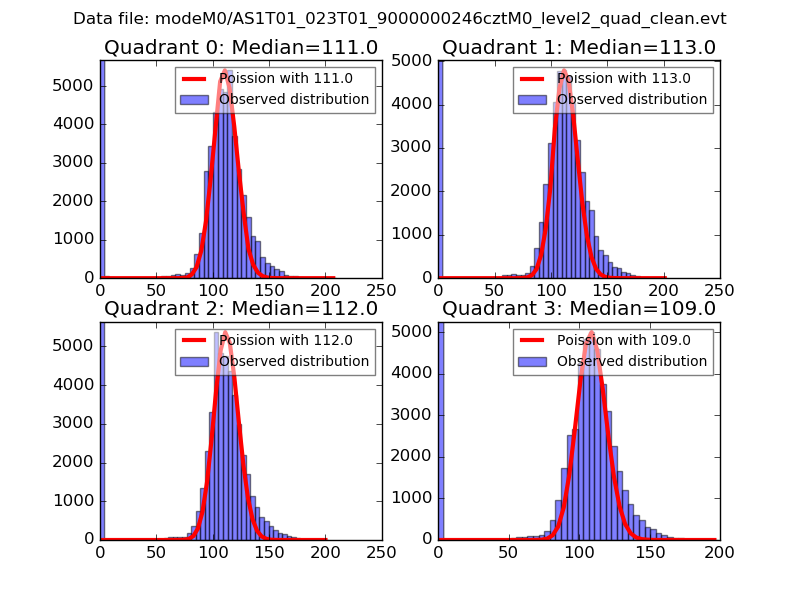 |
 |
| Quadrant-wise count rates Data is divided into 100 sec bins |
 |
|
| Module-wise count rates for Quadrant A Data is divided into 100 sec bins |
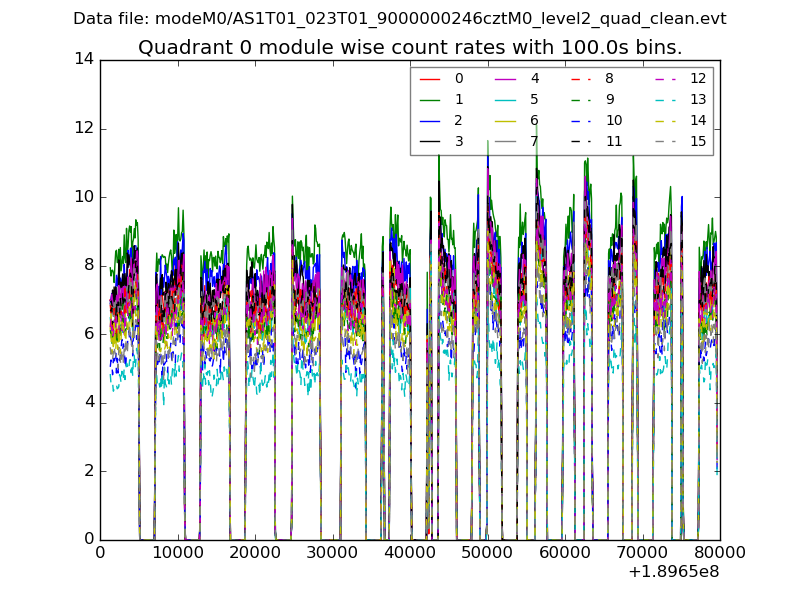 |
 |
| Module-wise count rates for Quadrant B Data is divided into 100 sec bins |
 |
 |
| Module-wise count rates for Quadrant C Data is divided into 100 sec bins |
 |
 |
| Module-wise count rates for Quadrant D Data is divided into 100 sec bins |
 |
 |
| Parameter | Plot |
|---|---|
| CZT HV Monitor | 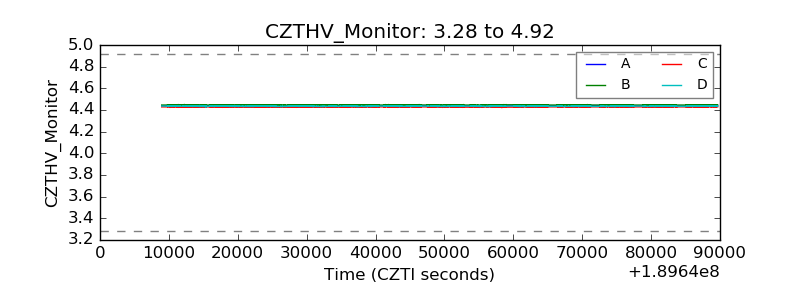 |
| D_VDD |  |
| Temperature 1 |  |
| Veto HV Monitor |  |
| Veto LLD |  |
| Alpha Counter |  |
| _CPM_Rate |  |
| CZT Counter |  |
| +2.5 Volts monitor |  |
| +5 Volts monitor |  |
| _ROLL_ROT |  |
| _Roll_DEC |  |
| _Roll_RA |  |
| Veto Counter |  |