| Param | Original file | Final file |
|---|---|---|
| Filename | modeM0/AS1G02_058T01_9000000242cztM0_level2_bc.evt | modeM0/AS1G02_058T01_9000000242cztM0_level2_quad_clean.evt |
| Size (bytes) | 759,317,760 | 234,550,080 |
| Size | 724.1 MB | 223.7 MB |
| Events in quadrant A | 3,523,460 | 1,486,061 |
| Events in quadrant B | 4,947,675 | 1,489,733 |
| Events in quadrant C | 4,954,236 | 1,472,339 |
| Events in quadrant D | 8,250,099 | 1,326,675 |
| Mode M9 | |||
|---|---|---|---|
| Quadrant | BADHDUFLAG | Total packets | Discarded packets |
| A | 0 | 35 | 0 |
| B | 0 | 35 | 0 |
| C | 0 | 35 | 0 |
| D | 0 | 35 | 0 |
| Mode SS | |||
|---|---|---|---|
| Quadrant | BADHDUFLAG | Total packets | Discarded packets |
| A | 0 | 392 | 0 |
| B | 0 | 392 | 0 |
| C | 0 | 392 | 0 |
| D | 0 | 392 | 0 |
| Mode M0 | |||
|---|---|---|---|
| Quadrant | BADHDUFLAG | Total packets | Discarded packets |
| A | 0 | 78273 | 0 |
| B | 0 | 87682 | 0 |
| C | 0 | 82492 | 0 |
| D | 0 | 99272 | 0 |
| Quadrant | Total seconds | Saturated seconds | Saturation percentage |
|---|---|---|---|
| A | 19282 | 43 | 0.223006% |
| B | 19281 | 85 | 0.440849% |
| C | 19281 | 70 | 0.363052% |
| D | 19284 | 2712 | 14.063472% |
Noise dominated data is calculated using 1-second bins in cleaned event files. If a bin has >2000 counts, and if more than 50% of those come from <1% of pixels, then it is considered to be noise-dominated and hence unusable.
| Quadrant | # 1 sec bins | Bins with >0 counts | Bins with >2000 counts | High rate bins dominated by noise | Noise dominated (total time) | Noise dominated (detector-on time) | Marked lightcurve |
|---|---|---|---|---|---|---|---|
| A | 25233 | 19289 | 11 | 11 | 0.04% | 0.06% |  |
| B | 25233 | 19288 | 5 | 5 | 0.02% | 0.03% | 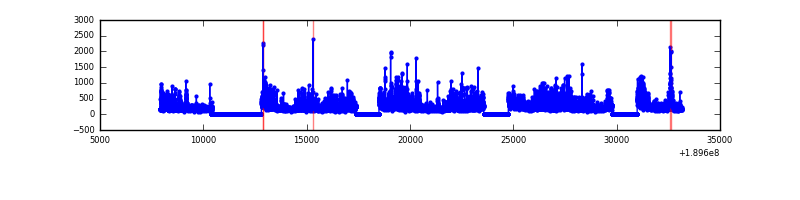 |
| C | 25233 | 19291 | 1 | 1 | 0.00% | 0.01% |  |
| D | 25233 | 19291 | 124 | 124 | 0.49% | 0.64% | 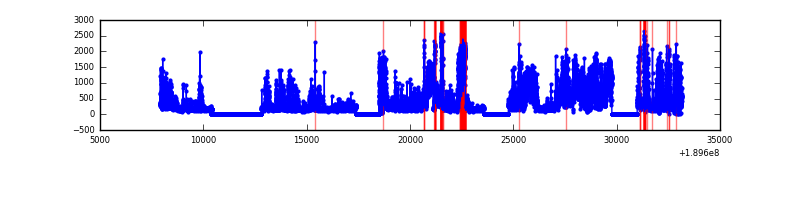 |
Top three noisy pixels from each quadrant. If the there are fewer than three noisy pixels in the level2.evt file, extra rows are filled as -1
| Pixel properties | Quadrant properties | ||||||
|---|---|---|---|---|---|---|---|
| Quadrant | DetID | PixID | Counts | Sigma | Mean | Median | Sigma |
| A | 4 | 32 | 128985 | 701.15 | 863 | 843 | 182.8 |
| A | 13 | 235 | 26655 | 141.24 | 863 | 843 | 182.8 |
| A | 15 | 127 | 20182 | 105.82 | 863 | 843 | 182.8 |
| B | 8 | 4 | 1058673 | 6762.14 | 880 | 854 | 156.4 |
| B | 6 | 53 | 149336 | 949.18 | 880 | 854 | 156.4 |
| B | 0 | 234 | 90164 | 570.92 | 880 | 854 | 156.4 |
| C | 15 | 241 | 1367295 | 7494.41 | 861 | 846 | 182.3 |
| C | 3 | 79 | 63059 | 341.21 | 861 | 846 | 182.3 |
| C | 12 | 4 | 46507 | 250.43 | 861 | 846 | 182.3 |
| D | 5 | 190 | 3873626 | 22770.27 | 784 | 763 | 170.1 |
| D | 9 | 53 | 1125712 | 6614.07 | 784 | 763 | 170.1 |
| D | 2 | 33 | 63986 | 371.72 | 784 | 763 | 170.1 |
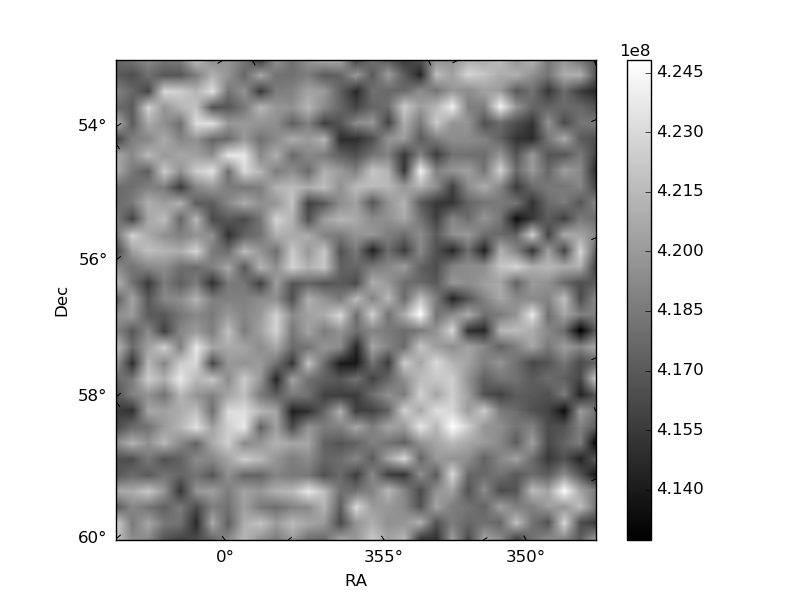
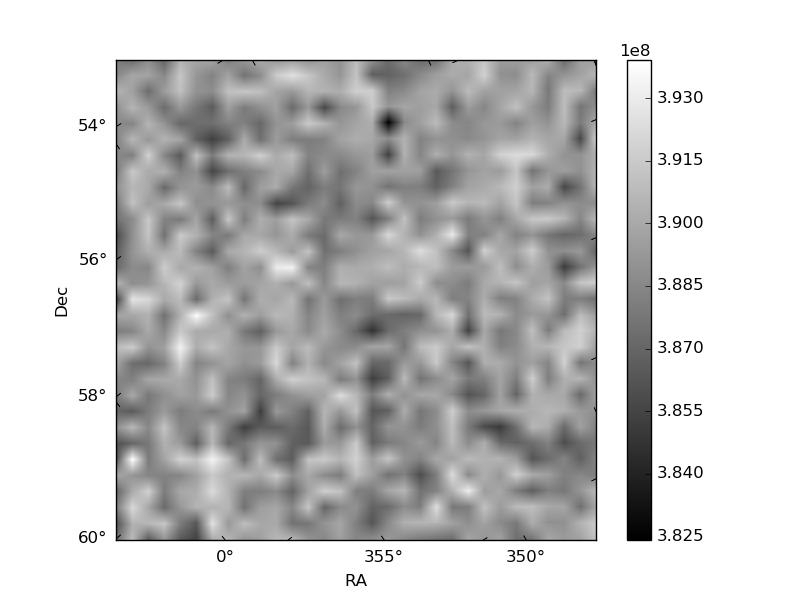
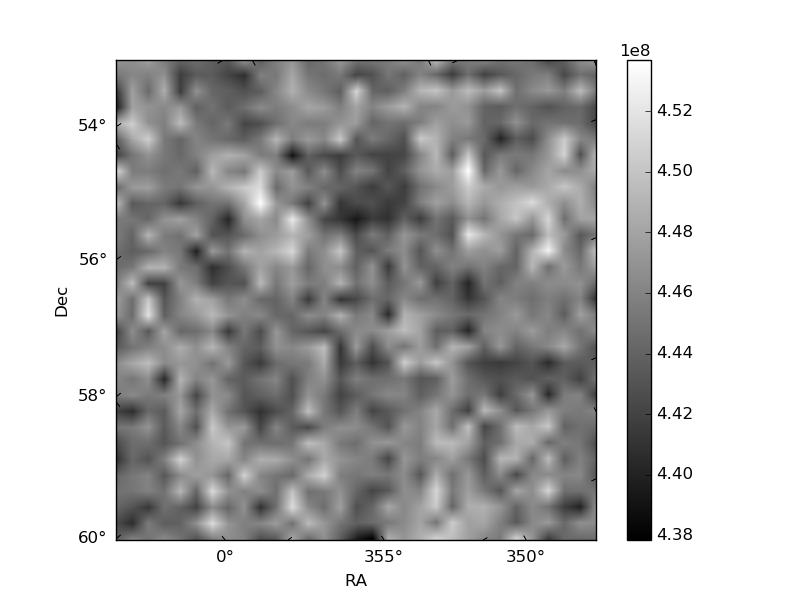
Histogram calculated using DETX and DETY for each event in the final _common_clean file
| Quadrant A |  |
 |
Quadrant B |
|---|---|---|---|
| Quadrant D |  |
 |
Quadrant C |
| Plot type | Count rate plots | Images |
|---|---|---|
| Comparison with Poisson distribution Blue bars denote a histogram of data divided into 1 sec bins. Red curve is a Poisson curve with rate = median count rate of data. |
 |
 |
| Quadrant-wise count rates Data is divided into 100 sec bins |
 |
|
| Module-wise count rates for Quadrant A Data is divided into 100 sec bins |
 |
 |
| Module-wise count rates for Quadrant B Data is divided into 100 sec bins |
 |
 |
| Module-wise count rates for Quadrant C Data is divided into 100 sec bins |
 |
 |
| Module-wise count rates for Quadrant D Data is divided into 100 sec bins |
 |
 |
| Parameter | Plot |
|---|---|
| CZT HV Monitor |  |
| D_VDD |  |
| Temperature 1 | 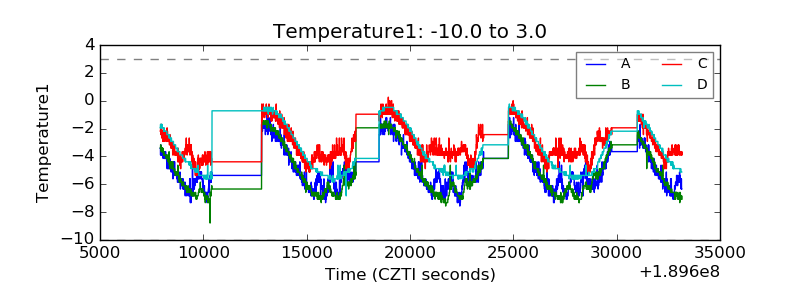 |
| Veto HV Monitor |  |
| Veto LLD |  |
| Alpha Counter | 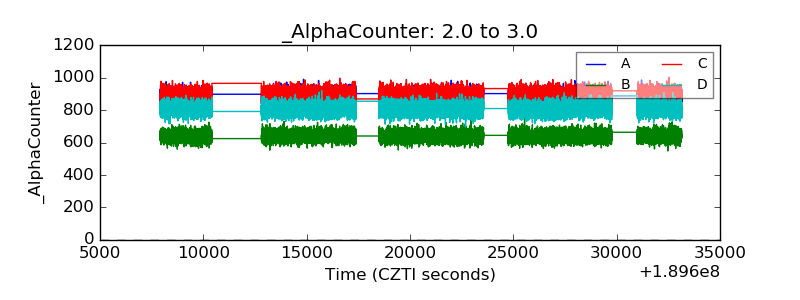 |
| _CPM_Rate | 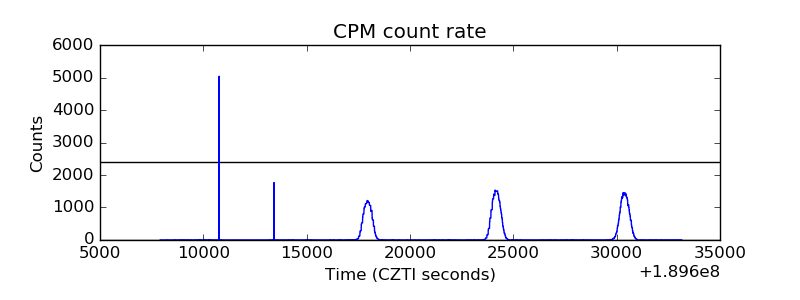 |
| CZT Counter |  |
| +2.5 Volts monitor |  |
| +5 Volts monitor |  |
| Veto Counter |  |