| Param | Original file | Final file |
|---|---|---|
| Filename | modeM0/AS1G02_034T02_9000000244cztM0_level2.evt | modeM0/AS1G02_034T02_9000000244cztM0_level2_quad_clean.evt |
| Size (bytes) | 1,871,648,640 | 139,014,720 |
| Size | 1.7 GB | 132.6 MB |
| Events in quadrant A | 13,902,356 | 841,606 |
| Events in quadrant B | 14,882,279 | 867,911 |
| Events in quadrant C | 14,150,797 | 863,652 |
| Events in quadrant D | 12,976,376 | 829,753 |
| Mode SS | |||
|---|---|---|---|
| Quadrant | BADHDUFLAG | Total packets | Discarded packets |
| A | 0 | 236 | 0 |
| B | 0 | 236 | 0 |
| C | 0 | 236 | 0 |
| D | 0 | 236 | 0 |
| Mode M0 | |||
|---|---|---|---|
| Quadrant | BADHDUFLAG | Total packets | Discarded packets |
| A | 0 | 49621 | 0 |
| B | 0 | 52495 | 0 |
| C | 0 | 50323 | 0 |
| D | 0 | 46989 | 0 |
| Mode M9 | |||
|---|---|---|---|
| Quadrant | BADHDUFLAG | Total packets | Discarded packets |
| A | 0 | 25 | 0 |
| B | 0 | 25 | 0 |
| C | 0 | 25 | 0 |
| D | 0 | 25 | 0 |
| Quadrant | Total seconds | Saturated seconds | Saturation percentage |
|---|---|---|---|
| A | 11673 | 62 | 0.531140% |
| B | 11673 | 65 | 0.556841% |
| C | 11673 | 31 | 0.265570% |
| D | 11673 | 378 | 3.238242% |
Noise dominated data is calculated using 1-second bins in cleaned event files. If a bin has >2000 counts, and if more than 50% of those come from <1% of pixels, then it is considered to be noise-dominated and hence unusable.
| Quadrant | # 1 sec bins | Bins with >0 counts | Bins with >2000 counts | High rate bins dominated by noise | Noise dominated (total time) | Noise dominated (detector-on time) | Marked lightcurve |
|---|---|---|---|---|---|---|---|
| A | 14093 | 11675 | 436 | 436 | 3.09% | 3.73% |  |
| B | 14093 | 11675 | 573 | 573 | 4.07% | 4.91% |  |
| C | 14093 | 11675 | 384 | 384 | 2.72% | 3.29% |  |
| D | 14093 | 11675 | 590 | 590 | 4.19% | 5.05% |  |
Top three noisy pixels from each quadrant. If the there are fewer than three noisy pixels in the level2.evt file, extra rows are filled as -1
| Pixel properties | Quadrant properties | ||||||
|---|---|---|---|---|---|---|---|
| Quadrant | DetID | PixID | Counts | Sigma | Mean | Median | Sigma |
| A | 4 | 32 | 364134 | 425.94 | 3523 | 3553 | 846.6 |
| A | 13 | 235 | 17692 | 16.7 | 3523 | 3553 | 846.6 |
| A | 11 | 79 | 13315 | 11.53 | 3523 | 3553 | 846.6 |
| B | 8 | 4 | 378662 | 435.05 | 3672 | 3702 | 861.9 |
| B | 5 | 249 | 159521 | 180.79 | 3672 | 3702 | 861.9 |
| B | 15 | 22 | 157677 | 178.65 | 3672 | 3702 | 861.9 |
| C | 15 | 241 | 945854 | 1021.54 | 3315 | 3425 | 922.6 |
| C | 12 | 4 | 106229 | 111.43 | 3315 | 3425 | 922.6 |
| C | 9 | 203 | 47496 | 47.77 | 3315 | 3425 | 922.6 |
| D | 5 | 190 | 1107760 | 1138.44 | 3139 | 3256 | 970.2 |
| D | 9 | 53 | 71281 | 70.12 | 3139 | 3256 | 970.2 |
| D | 5 | 82 | 32694 | 30.34 | 3139 | 3256 | 970.2 |
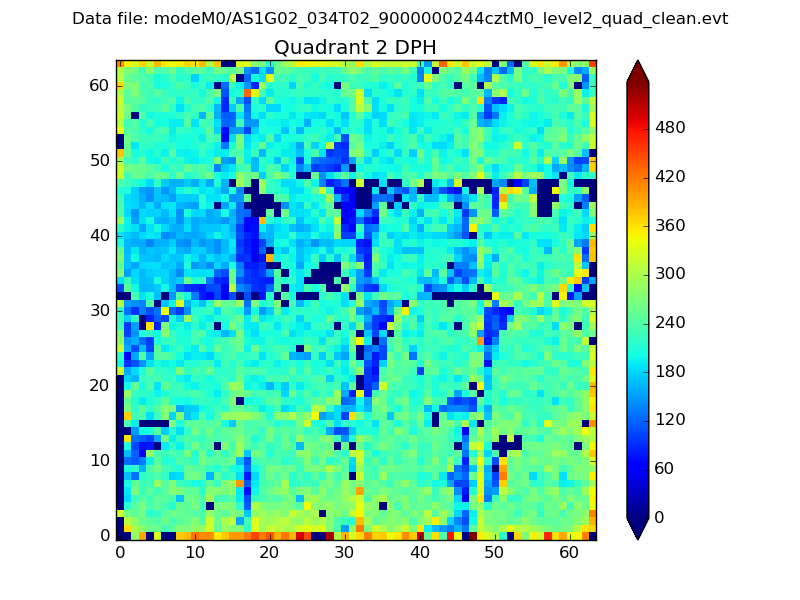
Histogram calculated using DETX and DETY for each event in the final _common_clean file
| Quadrant A |  |
 |
Quadrant B |
|---|---|---|---|
| Quadrant D |  |
 |
Quadrant C |
| Plot type | Count rate plots | Images |
|---|---|---|
| Comparison with Poisson distribution Blue bars denote a histogram of data divided into 1 sec bins. Red curve is a Poisson curve with rate = median count rate of data. |
 |
 |
| Quadrant-wise count rates Data is divided into 100 sec bins |
 |
|
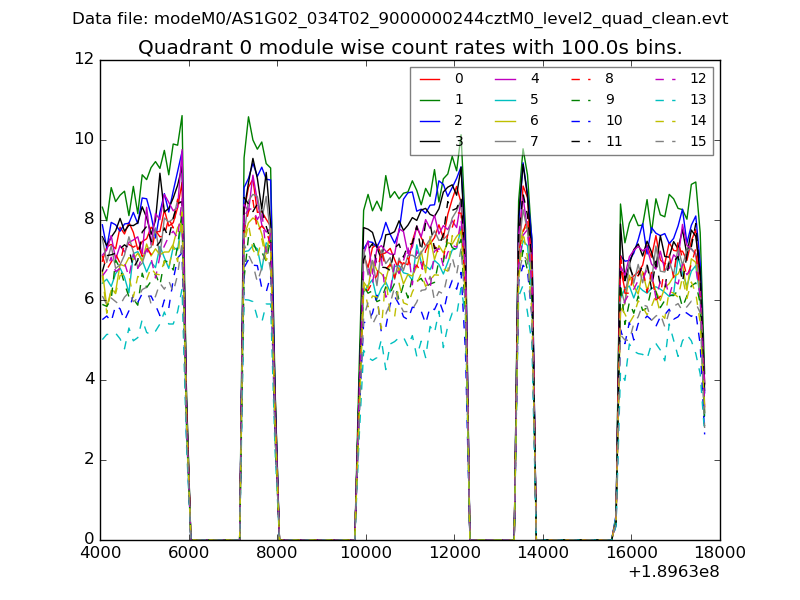
| Module-wise count rates for Quadrant A Data is divided into 100 sec bins |
 |
 |
| Module-wise count rates for Quadrant B Data is divided into 100 sec bins |
 |
 |
| Module-wise count rates for Quadrant C Data is divided into 100 sec bins |
 |
 |
| Module-wise count rates for Quadrant D Data is divided into 100 sec bins |
 |
 |
| Parameter | Plot |
|---|---|
| CZT HV Monitor |  |
| D_VDD |  |
| Temperature 1 | 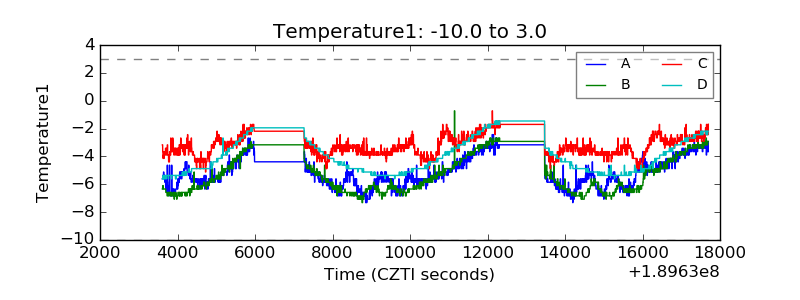 |
| Veto HV Monitor |  |
| Veto LLD |  |
| Alpha Counter |  |
| _CPM_Rate |  |
| CZT Counter |  |
| +2.5 Volts monitor |  |
| +5 Volts monitor |  |
| _ROLL_ROT |  |
| _Roll_DEC |  |
| _Roll_RA |  |
| Veto Counter |  |