| Param | Original file | Final file |
|---|---|---|
| Filename | modeM0/AS1G02_034T01_9000000240cztM0_level2.evt | modeM0/AS1G02_034T01_9000000240cztM0_level2_quad_clean.evt |
| Size (bytes) | 16,743,493,440 | 1,292,618,880 |
| Size | 15.6 GB | 1.2 GB |
| Events in quadrant A | 124,332,527 | 8,094,949 |
| Events in quadrant B | 136,181,601 | 8,207,917 |
| Events in quadrant C | 123,253,558 | 8,048,756 |
| Events in quadrant D | 116,559,645 | 7,764,507 |
| Mode M0 | |||
|---|---|---|---|
| Quadrant | BADHDUFLAG | Total packets | Discarded packets |
| A | 0 | 442456 | 0 |
| B | 0 | 477091 | 0 |
| C | 0 | 439036 | 0 |
| D | 0 | 419654 | 0 |
| Mode SS | |||
|---|---|---|---|
| Quadrant | BADHDUFLAG | Total packets | Discarded packets |
| A | 0 | 2088 | 0 |
| B | 0 | 2088 | 0 |
| C | 0 | 2088 | 0 |
| D | 0 | 2088 | 0 |
| Mode M9 | |||
|---|---|---|---|
| Quadrant | BADHDUFLAG | Total packets | Discarded packets |
| A | 0 | 126 | 0 |
| B | 0 | 126 | 0 |
| C | 0 | 126 | 0 |
| D | 0 | 126 | 0 |
| Quadrant | Total seconds | Saturated seconds | Saturation percentage |
|---|---|---|---|
| A | 102677 | 561 | 0.546374% |
| B | 102674 | 765 | 0.745077% |
| C | 102679 | 559 | 0.544415% |
| D | 102674 | 1205 | 1.173617% |
Noise dominated data is calculated using 1-second bins in cleaned event files. If a bin has >2000 counts, and if more than 50% of those come from <1% of pixels, then it is considered to be noise-dominated and hence unusable.
| Quadrant | # 1 sec bins | Bins with >0 counts | Bins with >2000 counts | High rate bins dominated by noise | Noise dominated (total time) | Noise dominated (detector-on time) | Marked lightcurve |
|---|---|---|---|---|---|---|---|
| A | 120732 | 102694 | 4342 | 4342 | 3.60% | 4.23% | 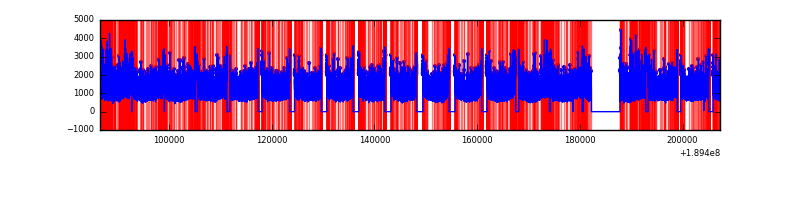 |
| B | 120732 | 102692 | 7053 | 7053 | 5.84% | 6.87% |  |
| C | 120732 | 102694 | 3828 | 3828 | 3.17% | 3.73% |  |
| D | 120732 | 102694 | 4787 | 4787 | 3.96% | 4.66% |  |
Top three noisy pixels from each quadrant. If the there are fewer than three noisy pixels in the level2.evt file, extra rows are filled as -1
| Pixel properties | Quadrant properties | ||||||
|---|---|---|---|---|---|---|---|
| Quadrant | DetID | PixID | Counts | Sigma | Mean | Median | Sigma |
| A | 15 | 127 | 1337453 | 170.27 | 31684 | 31912 | 7667.7 |
| A | 4 | 32 | 1109008 | 140.47 | 31684 | 31912 | 7667.7 |
| A | 11 | 79 | 132686 | 13.14 | 31684 | 31912 | 7667.7 |
| B | 8 | 4 | 5448305 | 703.92 | 32915 | 33151 | 7692.9 |
| B | 6 | 53 | 1659584 | 211.42 | 32915 | 33151 | 7692.9 |
| B | 12 | 52 | 1216915 | 153.88 | 32915 | 33151 | 7692.9 |
| C | 15 | 241 | 4909678 | 586.18 | 29926 | 31012 | 8322.8 |
| C | 14 | 223 | 745825 | 85.89 | 29926 | 31012 | 8322.8 |
| C | 3 | 111 | 353865 | 38.79 | 29926 | 31012 | 8322.8 |
| D | 9 | 53 | 4990056 | 548.17 | 28991 | 30102 | 9048.2 |
| D | 5 | 190 | 1105686 | 118.87 | 28991 | 30102 | 9048.2 |
| D | 10 | 125 | 590656 | 61.95 | 28991 | 30102 | 9048.2 |
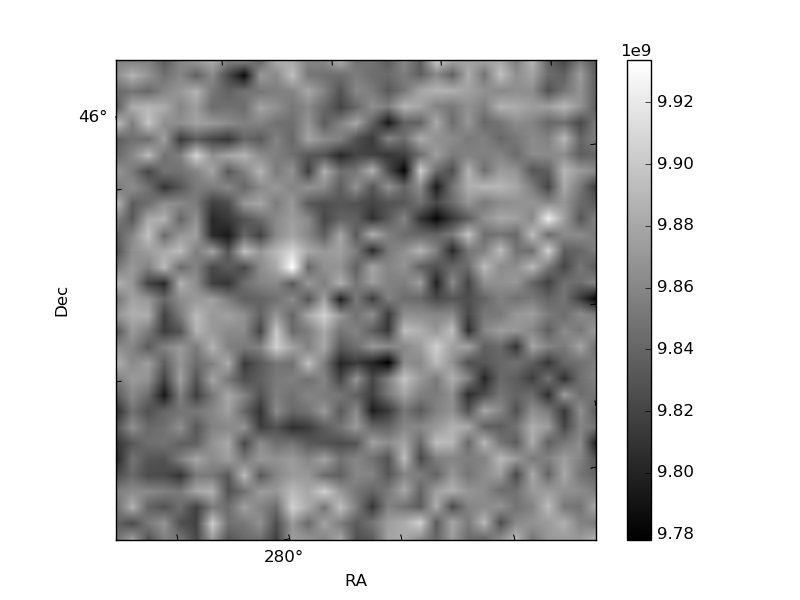
Histogram calculated using DETX and DETY for each event in the final _common_clean file
| Quadrant A |  |
 |
Quadrant B |
|---|---|---|---|
| Quadrant D |  |
 |
Quadrant C |
| Plot type | Count rate plots | Images |
|---|---|---|
| Comparison with Poisson distribution Blue bars denote a histogram of data divided into 1 sec bins. Red curve is a Poisson curve with rate = median count rate of data. |
 |
 |
| Quadrant-wise count rates Data is divided into 100 sec bins |
 |
|
| Module-wise count rates for Quadrant A Data is divided into 100 sec bins |
 |
 |
| Module-wise count rates for Quadrant B Data is divided into 100 sec bins |
 |
 |
| Module-wise count rates for Quadrant C Data is divided into 100 sec bins |
 |
 |
| Module-wise count rates for Quadrant D Data is divided into 100 sec bins |
 |
 |
| Parameter | Plot |
|---|---|
| CZT HV Monitor | 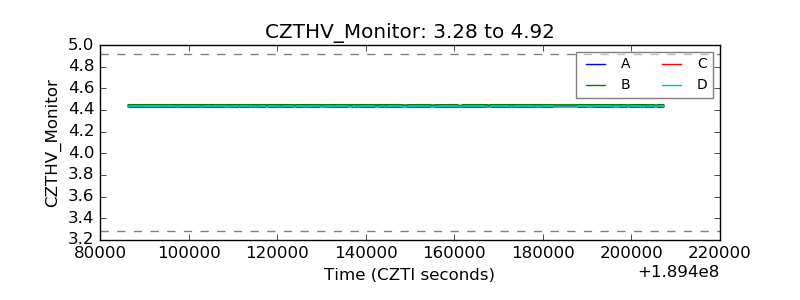 |
| D_VDD | 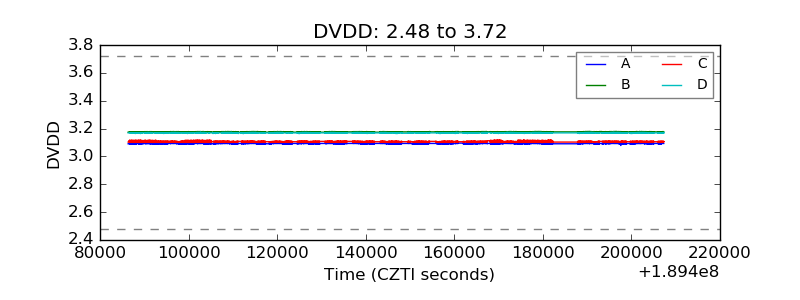 |
| Temperature 1 |  |
| Veto HV Monitor |  |
| Veto LLD |  |
| Alpha Counter | 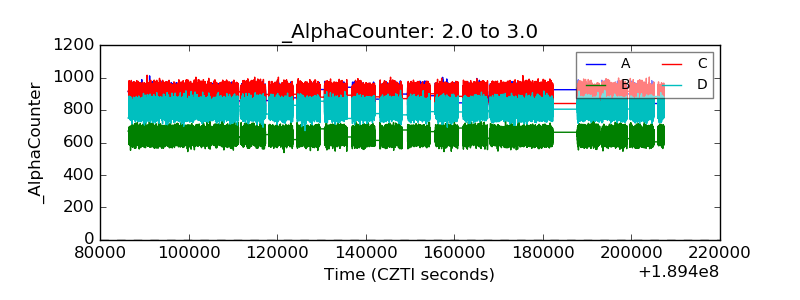 |
| _CPM_Rate |  |
| CZT Counter |  |
| +2.5 Volts monitor |  |
| +5 Volts monitor | 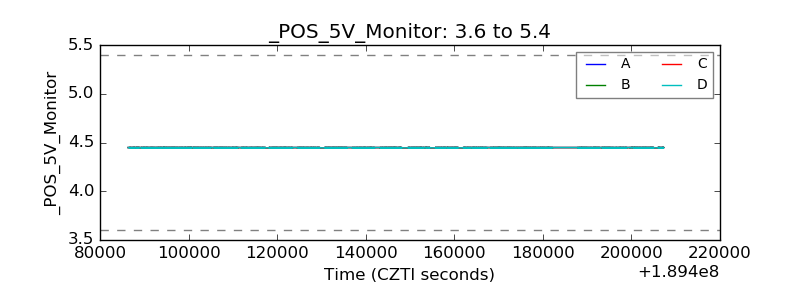 |
| _ROLL_ROT | 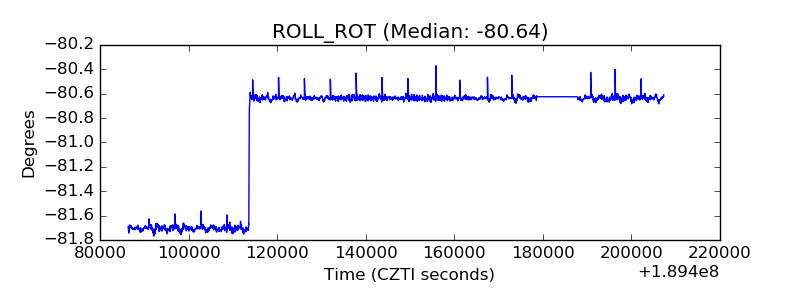 |
| _Roll_DEC |  |
| _Roll_RA |  |
| Veto Counter | 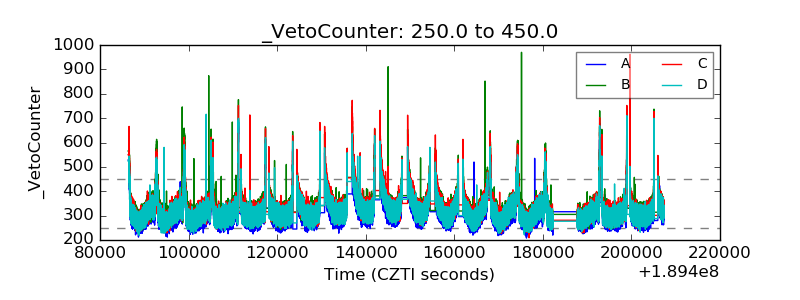 |