| Param | Original file | Final file |
|---|---|---|
| Filename | modeM0/AS1P01_999T99_9000000238cztM0_level2_bc.evt | modeM0/AS1P01_999T99_9000000238cztM0_level2_quad_clean.evt |
| Size (bytes) | 3,502,241,280 | 1,228,616,640 |
| Size | 3.3 GB | 1.1 GB |
| Events in quadrant A | 42,087,957 | 7,727,602 |
| Events in quadrant B | 20,206,103 | 8,091,059 |
| Events in quadrant C | 17,793,599 | 7,977,118 |
| Events in quadrant D | 20,362,490 | 7,760,786 |
| Mode M9 | |||
|---|---|---|---|
| Quadrant | BADHDUFLAG | Total packets | Discarded packets |
| A | 0 | 119 | 0 |
| B | 0 | 119 | 0 |
| C | 0 | 119 | 0 |
| D | 0 | 119 | 0 |
| Mode SS | |||
|---|---|---|---|
| Quadrant | BADHDUFLAG | Total packets | Discarded packets |
| A | 0 | 1680 | 0 |
| B | 0 | 1680 | 0 |
| C | 0 | 1680 | 0 |
| D | 0 | 1680 | 0 |
| Mode M0 | |||
|---|---|---|---|
| Quadrant | BADHDUFLAG | Total packets | Discarded packets |
| A | 0 | 445861 | 0 |
| B | 0 | 378228 | 0 |
| C | 0 | 345331 | 0 |
| D | 0 | 339901 | 0 |
| Quadrant | Total seconds | Saturated seconds | Saturation percentage |
|---|---|---|---|
| A | 82511 | 6654 | 8.064379% |
| B | 82511 | 1004 | 1.216807% |
| C | 82511 | 285 | 0.345408% |
| D | 82510 | 1721 | 2.085808% |
Noise dominated data is calculated using 1-second bins in cleaned event files. If a bin has >2000 counts, and if more than 50% of those come from <1% of pixels, then it is considered to be noise-dominated and hence unusable.
| Quadrant | # 1 sec bins | Bins with >0 counts | Bins with >2000 counts | High rate bins dominated by noise | Noise dominated (total time) | Noise dominated (detector-on time) | Marked lightcurve |
|---|---|---|---|---|---|---|---|
| A | 94426 | 82503 | 607 | 607 | 0.64% | 0.74% |  |
| B | 94426 | 82510 | 314 | 314 | 0.33% | 0.38% |  |
| C | 94426 | 82502 | 19 | 19 | 0.02% | 0.02% |  |
| D | 94426 | 82423 | 523 | 523 | 0.55% | 0.63% |  |
Top three noisy pixels from each quadrant. If the there are fewer than three noisy pixels in the level2.evt file, extra rows are filled as -1
| Pixel properties | Quadrant properties | ||||||
|---|---|---|---|---|---|---|---|
| Quadrant | DetID | PixID | Counts | Sigma | Mean | Median | Sigma |
| A | 15 | 127 | 28102141 | 38421.34 | 3448 | 3372 | 731.3 |
| A | 13 | 17 | 209741 | 282.18 | 3448 | 3372 | 731.3 |
| A | 4 | 32 | 85410 | 112.18 | 3448 | 3372 | 731.3 |
| B | 8 | 4 | 2078732 | 3138.97 | 3636 | 3514 | 661.1 |
| B | 5 | 249 | 1362169 | 2055.1 | 3636 | 3514 | 661.1 |
| B | 12 | 52 | 748706 | 1127.17 | 3636 | 3514 | 661.1 |
| C | 15 | 241 | 3108834 | 4201.34 | 3517 | 3449 | 739.1 |
| C | 3 | 79 | 315390 | 422.03 | 3517 | 3449 | 739.1 |
| C | 3 | 111 | 161220 | 213.45 | 3517 | 3449 | 739.1 |
| D | 5 | 190 | 1775948 | 2338.79 | 3481 | 3371 | 757.9 |
| D | 12 | 79 | 1754457 | 2310.43 | 3481 | 3371 | 757.9 |
| D | 9 | 53 | 730345 | 959.19 | 3481 | 3371 | 757.9 |
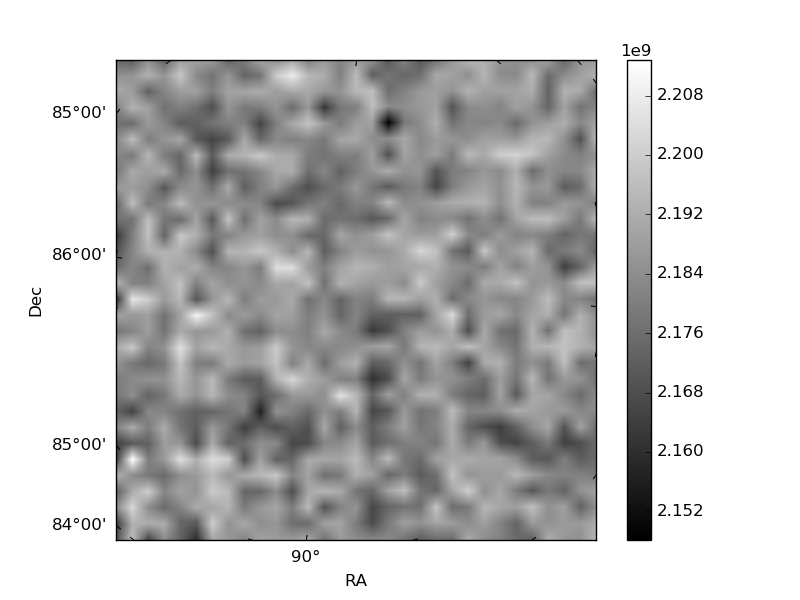
Histogram calculated using DETX and DETY for each event in the final _common_clean file
| Quadrant A |  |
 |
Quadrant B |
|---|---|---|---|
| Quadrant D | 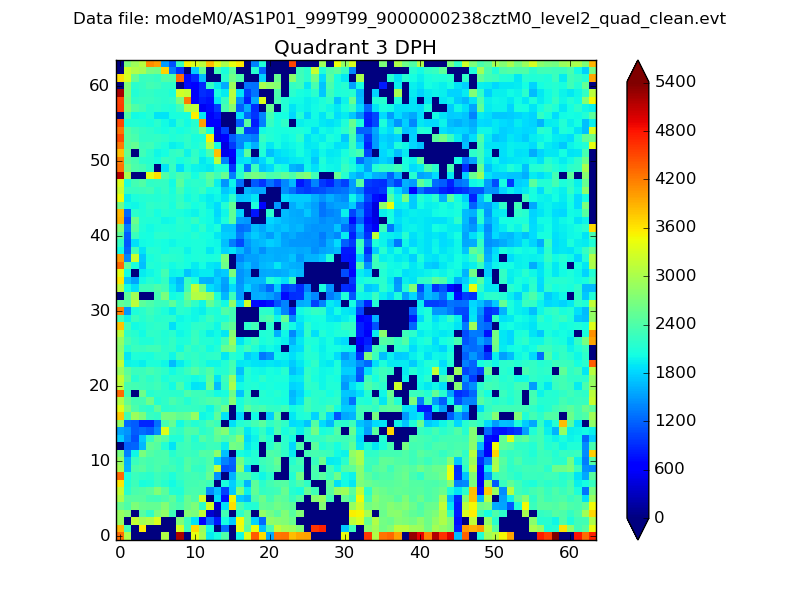 |
 |
Quadrant C |
| Plot type | Count rate plots | Images |
|---|---|---|
| Comparison with Poisson distribution Blue bars denote a histogram of data divided into 1 sec bins. Red curve is a Poisson curve with rate = median count rate of data. |
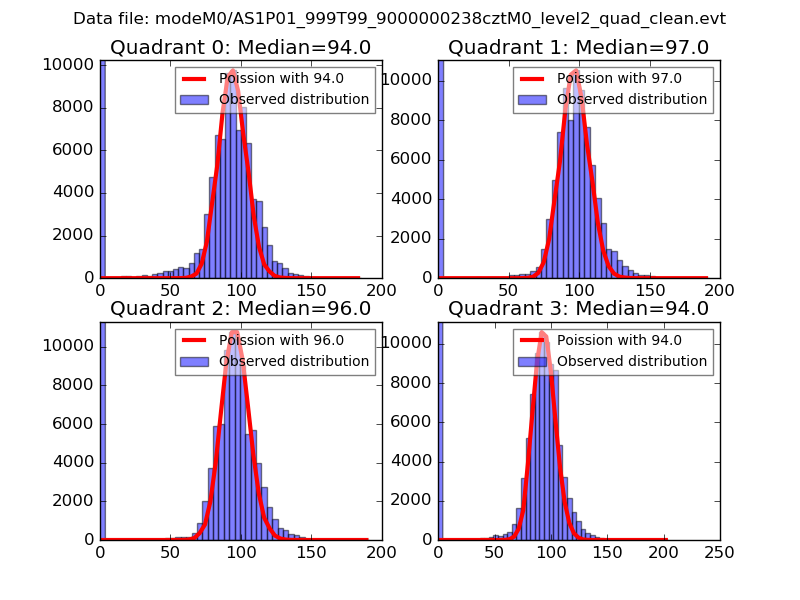 |
 |
| Quadrant-wise count rates Data is divided into 100 sec bins |
 |
|
| Module-wise count rates for Quadrant A Data is divided into 100 sec bins |
 |
 |
| Module-wise count rates for Quadrant B Data is divided into 100 sec bins |
 |
 |
| Module-wise count rates for Quadrant C Data is divided into 100 sec bins |
 |
 |
| Module-wise count rates for Quadrant D Data is divided into 100 sec bins |
 |
 |
| Parameter | Plot |
|---|---|
| CZT HV Monitor |  |
| D_VDD |  |
| Temperature 1 |  |
| Veto HV Monitor |  |
| Veto LLD |  |
| Alpha Counter |  |
| _CPM_Rate |  |
| CZT Counter |  |
| +2.5 Volts monitor | 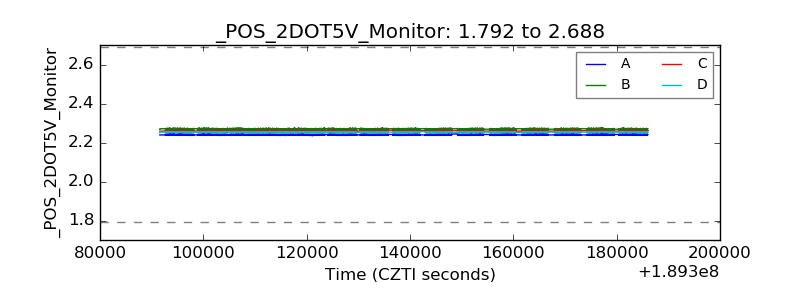 |
| +5 Volts monitor |  |
| _ROLL_ROT |  |
| _Roll_DEC |  |
| _Roll_RA |  |
| Veto Counter |  |