| Param | Original file | Final file |
|---|---|---|
| Filename | modeM0/AS1G04_003T02_9000000236cztM0_level2_bc.evt | modeM0/AS1G04_003T02_9000000236cztM0_level2_quad_clean.evt |
| Size (bytes) | 1,487,989,440 | 565,476,480 |
| Size | 1.4 GB | 539.3 MB |
| Events in quadrant A | 17,667,476 | 3,614,722 |
| Events in quadrant B | 8,412,255 | 3,701,287 |
| Events in quadrant C | 8,298,589 | 3,666,186 |
| Events in quadrant D | 8,166,268 | 3,607,887 |
| Mode M0 | |||
|---|---|---|---|
| Quadrant | BADHDUFLAG | Total packets | Discarded packets |
| A | 0 | 188797 | 0 |
| B | 0 | 164359 | 0 |
| C | 0 | 154483 | 0 |
| D | 0 | 146844 | 0 |
| Mode SS | |||
|---|---|---|---|
| Quadrant | BADHDUFLAG | Total packets | Discarded packets |
| A | 0 | 752 | 0 |
| B | 0 | 752 | 0 |
| C | 0 | 752 | 0 |
| D | 0 | 752 | 0 |
| Mode M9 | |||
|---|---|---|---|
| Quadrant | BADHDUFLAG | Total packets | Discarded packets |
| A | 0 | 75 | 0 |
| B | 0 | 75 | 0 |
| C | 0 | 75 | 0 |
| D | 0 | 75 | 0 |
| Quadrant | Total seconds | Saturated seconds | Saturation percentage |
|---|---|---|---|
| A | 36963 | 1271 | 3.438574% |
| B | 36963 | 233 | 0.630360% |
| C | 36963 | 134 | 0.362525% |
| D | 36963 | 536 | 1.450099% |
Noise dominated data is calculated using 1-second bins in cleaned event files. If a bin has >2000 counts, and if more than 50% of those come from <1% of pixels, then it is considered to be noise-dominated and hence unusable.
| Quadrant | # 1 sec bins | Bins with >0 counts | Bins with >2000 counts | High rate bins dominated by noise | Noise dominated (total time) | Noise dominated (detector-on time) | Marked lightcurve |
|---|---|---|---|---|---|---|---|
| A | 44398 | 36958 | 478 | 478 | 1.08% | 1.29% |  |
| B | 44398 | 36961 | 16 | 16 | 0.04% | 0.04% |  |
| C | 44398 | 36961 | 11 | 11 | 0.02% | 0.03% |  |
| D | 44398 | 36958 | 31 | 31 | 0.07% | 0.08% |  |
Top three noisy pixels from each quadrant. If the there are fewer than three noisy pixels in the level2.evt file, extra rows are filled as -1
| Pixel properties | Quadrant properties | ||||||
|---|---|---|---|---|---|---|---|
| Quadrant | DetID | PixID | Counts | Sigma | Mean | Median | Sigma |
| A | 15 | 127 | 6865559 | 20235.5 | 1603 | 1569 | 339.2 |
| A | 4 | 32 | 3950862 | 11642.78 | 1603 | 1569 | 339.2 |
| A | 12 | 243 | 311296 | 913.1 | 1603 | 1569 | 339.2 |
| B | 8 | 4 | 406609 | 1370.91 | 1656 | 1610 | 295.4 |
| B | 6 | 53 | 356580 | 1201.57 | 1656 | 1610 | 295.4 |
| B | 5 | 249 | 346599 | 1167.78 | 1656 | 1610 | 295.4 |
| C | 15 | 241 | 1487912 | 4360.65 | 1610 | 1581 | 340.9 |
| C | 3 | 79 | 144179 | 418.36 | 1610 | 1581 | 340.9 |
| C | 9 | 54 | 100047 | 288.88 | 1610 | 1581 | 340.9 |
| D | 9 | 53 | 661373 | 1889.31 | 1605 | 1555 | 349.2 |
| D | 9 | 66 | 375140 | 1069.72 | 1605 | 1555 | 349.2 |
| D | 12 | 22 | 260427 | 741.25 | 1605 | 1555 | 349.2 |
Histogram calculated using DETX and DETY for each event in the final _common_clean file
| Quadrant A | 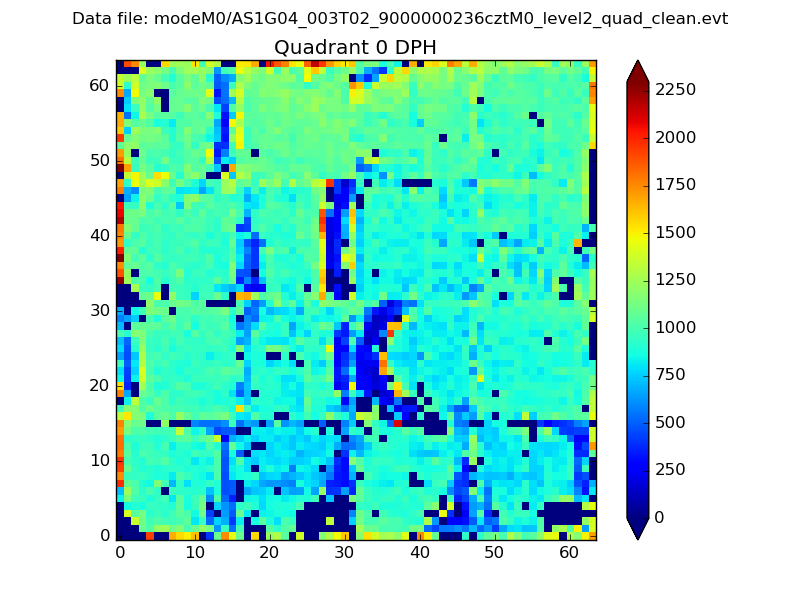 |
 |
Quadrant B |
|---|---|---|---|
| Quadrant D | 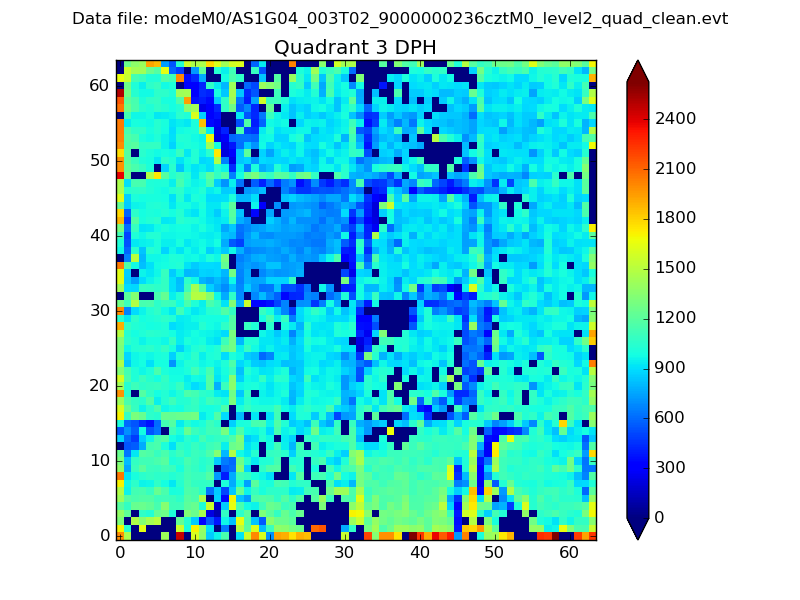 |
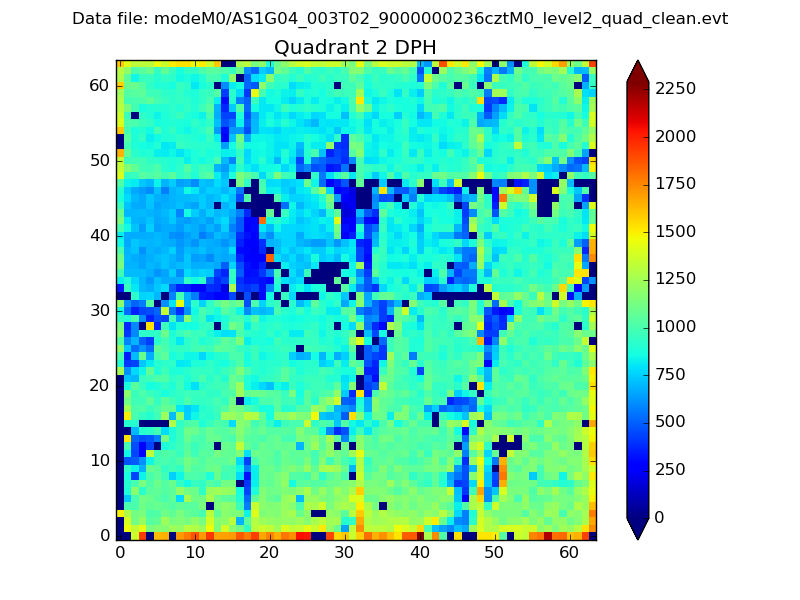 |
Quadrant C |
| Plot type | Count rate plots | Images |
|---|---|---|
| Comparison with Poisson distribution Blue bars denote a histogram of data divided into 1 sec bins. Red curve is a Poisson curve with rate = median count rate of data. |
 |
 |
| Quadrant-wise count rates Data is divided into 100 sec bins |
 |
|
| Module-wise count rates for Quadrant A Data is divided into 100 sec bins |
 |
 |
| Module-wise count rates for Quadrant B Data is divided into 100 sec bins |
 |
 |
| Module-wise count rates for Quadrant C Data is divided into 100 sec bins |
 |
 |
| Module-wise count rates for Quadrant D Data is divided into 100 sec bins |
 |
 |
| Parameter | Plot |
|---|---|
| CZT HV Monitor | 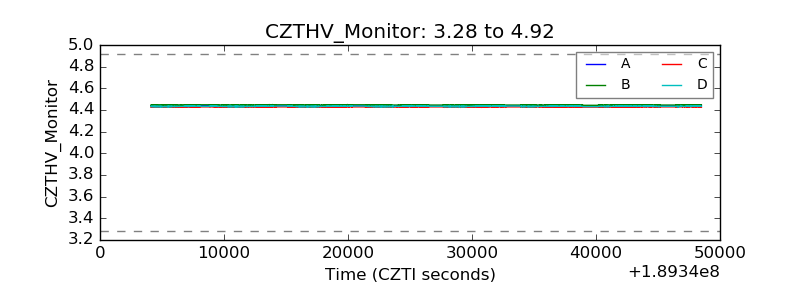 |
| D_VDD |  |
| Temperature 1 |  |
| Veto HV Monitor | 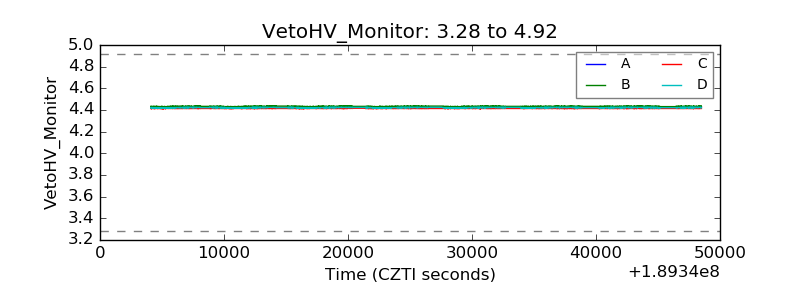 |
| Veto LLD |  |
| Alpha Counter |  |
| _CPM_Rate |  |
| CZT Counter |  |
| +2.5 Volts monitor |  |
| +5 Volts monitor |  |
| _ROLL_ROT |  |
| _Roll_DEC | 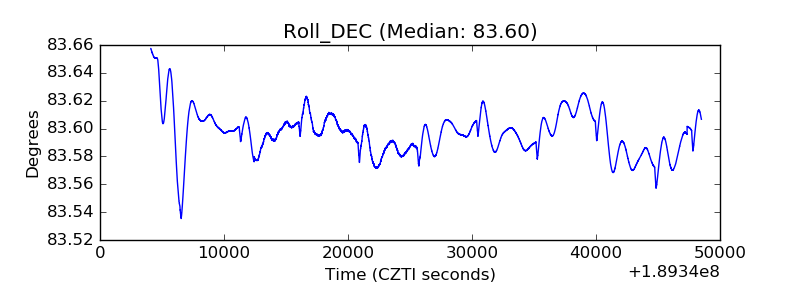 |
| _Roll_RA |  |
| Veto Counter | 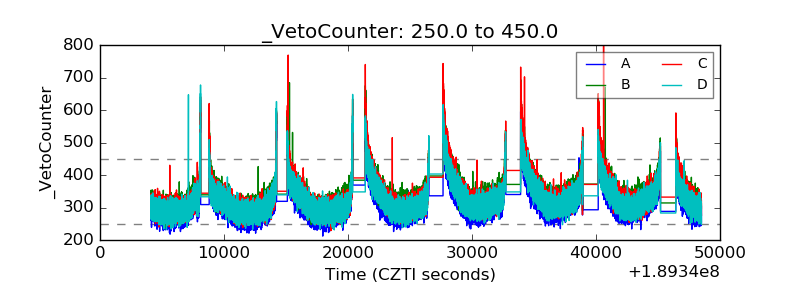 |