| Param | Original file | Final file |
|---|---|---|
| Filename | modeM0/AS1G04_003T01_9000000234cztM0_level2.evt | modeM0/AS1G04_003T01_9000000234cztM0_level2_quad_clean.evt |
| Size (bytes) | 8,613,561,600 | 844,704,000 |
| Size | 8.0 GB | 805.6 MB |
| Events in quadrant A | 77,024,501 | 5,457,354 |
| Events in quadrant B | 66,292,885 | 5,673,267 |
| Events in quadrant C | 58,461,469 | 5,567,964 |
| Events in quadrant D | 55,780,465 | 5,436,924 |
| Mode SS | |||
|---|---|---|---|
| Quadrant | BADHDUFLAG | Total packets | Discarded packets |
| A | 0 | 1020 | 0 |
| B | 0 | 1020 | 0 |
| C | 0 | 1020 | 0 |
| D | 0 | 1020 | 0 |
| Mode M9 | |||
|---|---|---|---|
| Quadrant | BADHDUFLAG | Total packets | Discarded packets |
| A | 0 | 59 | 0 |
| B | 0 | 59 | 0 |
| C | 0 | 59 | 0 |
| D | 0 | 59 | 0 |
| Mode M0 | |||
|---|---|---|---|
| Quadrant | BADHDUFLAG | Total packets | Discarded packets |
| A | 0 | 264368 | 0 |
| B | 0 | 232560 | 0 |
| C | 0 | 209514 | 0 |
| D | 0 | 201663 | 0 |
| Quadrant | Total seconds | Saturated seconds | Saturation percentage |
|---|---|---|---|
| A | 50311 | 1919 | 3.814275% |
| B | 50311 | 624 | 1.240285% |
| C | 50311 | 192 | 0.381626% |
| D | 50311 | 332 | 0.659895% |
Noise dominated data is calculated using 1-second bins in cleaned event files. If a bin has >2000 counts, and if more than 50% of those come from <1% of pixels, then it is considered to be noise-dominated and hence unusable.
| Quadrant | # 1 sec bins | Bins with >0 counts | Bins with >2000 counts | High rate bins dominated by noise | Noise dominated (total time) | Noise dominated (detector-on time) | Marked lightcurve |
|---|---|---|---|---|---|---|---|
| A | 56107 | 50317 | 9073 | 9073 | 16.17% | 18.03% |  |
| B | 56107 | 50318 | 3832 | 3832 | 6.83% | 7.62% |  |
| C | 56107 | 50321 | 1541 | 1541 | 2.75% | 3.06% |  |
| D | 56107 | 50320 | 1943 | 1943 | 3.46% | 3.86% |  |
Top three noisy pixels from each quadrant. If the there are fewer than three noisy pixels in the level2.evt file, extra rows are filled as -1
| Pixel properties | Quadrant properties | ||||||
|---|---|---|---|---|---|---|---|
| Quadrant | DetID | PixID | Counts | Sigma | Mean | Median | Sigma |
| A | 15 | 127 | 17086480 | 4701.74 | 15098 | 15207 | 3630.8 |
| A | 4 | 32 | 1522654 | 415.18 | 15098 | 15207 | 3630.8 |
| A | 15 | 233 | 170315 | 42.72 | 15098 | 15207 | 3630.8 |
| B | 8 | 4 | 3385729 | 908.03 | 15804 | 15897 | 3711.2 |
| B | 6 | 53 | 872034 | 230.69 | 15804 | 15897 | 3711.2 |
| B | 12 | 52 | 830162 | 219.41 | 15804 | 15897 | 3711.2 |
| C | 15 | 241 | 1885302 | 472.0 | 14273 | 14764 | 3963.0 |
| C | 2 | 53 | 425349 | 103.6 | 14273 | 14764 | 3963.0 |
| C | 3 | 79 | 186215 | 43.26 | 14273 | 14764 | 3963.0 |
| D | 9 | 53 | 1467991 | 345.24 | 13896 | 14396 | 4210.4 |
| D | 9 | 66 | 743293 | 173.12 | 13896 | 14396 | 4210.4 |
| D | 13 | 169 | 457190 | 105.17 | 13896 | 14396 | 4210.4 |
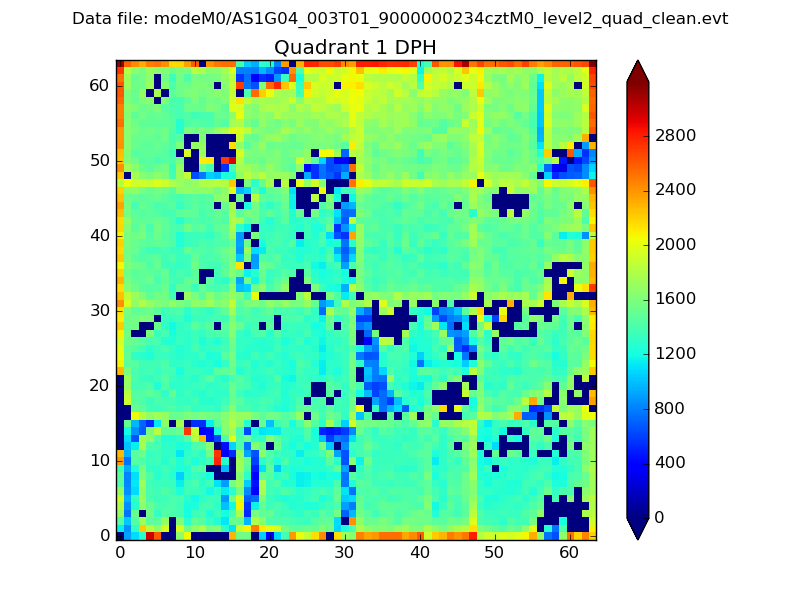
Histogram calculated using DETX and DETY for each event in the final _common_clean file
| Quadrant A |  |
 |
Quadrant B |
|---|---|---|---|
| Quadrant D |  |
 |
Quadrant C |
| Plot type | Count rate plots | Images |
|---|---|---|
| Comparison with Poisson distribution Blue bars denote a histogram of data divided into 1 sec bins. Red curve is a Poisson curve with rate = median count rate of data. |
 |
 |
| Quadrant-wise count rates Data is divided into 100 sec bins |
 |
|
| Module-wise count rates for Quadrant A Data is divided into 100 sec bins |
 |
 |
| Module-wise count rates for Quadrant B Data is divided into 100 sec bins |
 |
 |
| Module-wise count rates for Quadrant C Data is divided into 100 sec bins |
 |
 |
| Module-wise count rates for Quadrant D Data is divided into 100 sec bins |
 |
 |
| Parameter | Plot |
|---|---|
| CZT HV Monitor |  |
| D_VDD |  |
| Temperature 1 |  |
| Veto HV Monitor |  |
| Veto LLD |  |
| Alpha Counter |  |
| _CPM_Rate |  |
| CZT Counter |  |
| +2.5 Volts monitor |  |
| +5 Volts monitor |  |
| _ROLL_ROT |  |
| _Roll_DEC |  |
| _Roll_RA |  |
| Veto Counter | 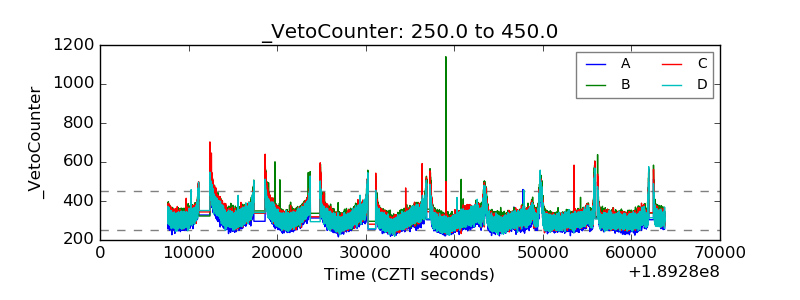 |